Past performance does not predict future returns. You may get back less than you originally invested. Reference to specific securities is not intended as a recommendation to purchase or sell any investment.
This article is featured in the Q1 2026 Future Strategist newsletter, you can read the rest of the newsletter here.
The magnitude of capital being deployed into AI infrastructure is unprecedented in the history of technology. The five largest AI infrastructure spenders are collectively projecting $658 billion in capital expenditure for 2026, which is a year-over-year (YoY) increase of 77%.
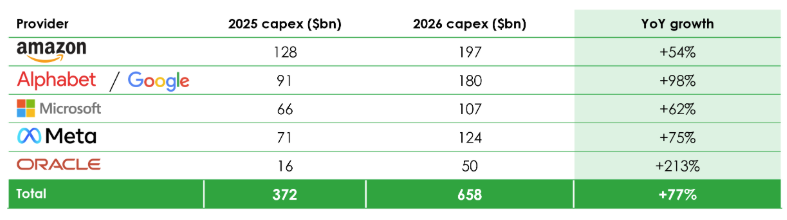
Source: Bloomberg, as at April 2026. YoY = Year-over-Year.
Approximately 75%, or nearly $500 billion, of 2026 spend is directly tied to AI infrastructure – servers, GPUs, data centres and networking, according to Omdia and Futurum Group. Alphabet has revised its 2026 capex guidance upwards three times, from an initial $71-$73 billion, ultimately landing at $180 billion. Goldman Sachs notes that at the start of both 2024 and 2025, consensus capex estimates implied about 20% growth, but actual spending came in above 50% in both years.
The market has consistently underestimated the pace of AI infrastructure spend. One big question for the capex names is whether this will continue from a much higher base number, especially given that large cap names are already heading towards negative cash flows after increased capex for the 2026 year.
Bernstein published an interesting table during the quarter which shows the proportion of Nvidia revenues that were covered by hyperscaler capex:
Nvidia revenues covered by Hyperscaler capex
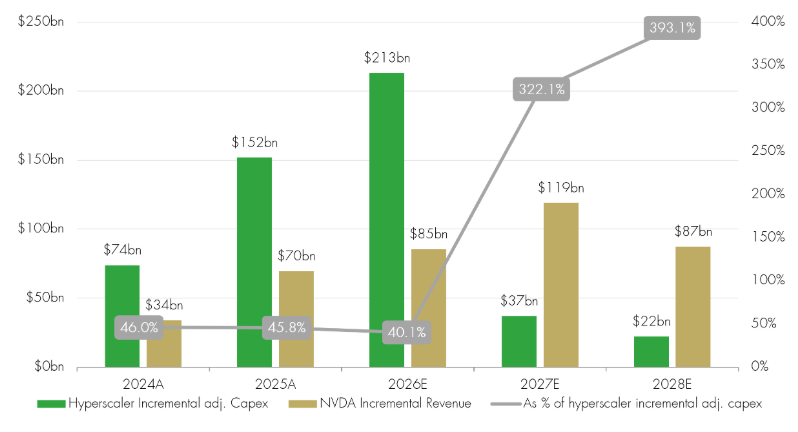
Source: Bernstein, as at April 2026.
This shows that hyperscaler capex has run at about 40%-46% of Nvidia revenues in the 2024-2026(E) period. The forward-looking guidance for Nvidia revenues and capex guidance from the biggest companies suggests this relationship is about to break down; it might also mean that either Nvidia revenues are too optimistic or capex levels from the biggest companies will step up yet again. It is hard to know which.
This uncertainty, coupled with equally uncertain outcomes on the path of revenue generated from AI, leads to many of the biggest companies struggling to make progress in share price terms. Nvidia’s share price has not made much progress for a year now.
We are starting to get better indicators of revenues building from AI usage, something that has been lacking. The table below shows foundational revenues from key cloud providers. This is not all AI based but the accelerated growth is certainly driven by AI.
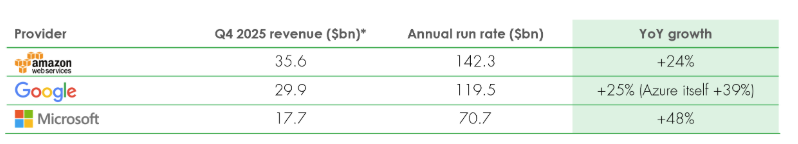
Source: Bloomberg, as at April 2026.
The AI-specific revenue streams are now reaching material scale across every major hyperscaler. At AWS, Amazon Bedrock (a managed AI platform) has greater than 100,000 enterprise customers, a multi-billion-dollar ARR (annualised recurring revenue) and reported +60% sequential growth in the fourth quarter of 2025. Google Cloud reported 14 products with more than $1 billion in annual revenues. Revenue from products built on proprietary AI models (Gemini, Imagen and Veo) grew about 400% YoY in the fourth quarter of 2025. Microsoft Azure holds a $625 billion backlog, up 110% YoY with $80 billion of orders that cannot be fulfilled due to power constraints – a supply-side bottleneck, not demand weakness.
On the demand side, companies sitting between mega scalers and the end users have seen revenues surge. Anthropic has seen turbo charged growth with an annualised run rate just declared of $30 billion, up from an annualised $9 billion at the end of 2025; this is mind-boggling growth. OpenAI is reporting a revenue run rate of $20 billion annualised (end of 2025), up from $2 billion in 2023, a 10-times increase in two years. In absolute terms, this is lower than Anthropic, reflecting the more consumer-led subscription model, but, nevertheless, growth rates are impressive.
All the evidence is that the demand is real – all the major hyperscalers explicitly stated in fourth quarter 2025 earnings calls that capacity is supply-constrained, not demand-constrained. In January 2026, T. Rowe Price framed the competitive dynamic as a game theory Nash Equilibrium in which aggressive investment is the dominant strategy regardless of what competitors do for three reasons: (1) physical supply constraints, (2) power infrastructure lead times of three to five years, and (3) advanced chip fabs requiring multi-billion-dollar investments driving new capacity that then drives volume more than it lowers the price. This is a "modern Jevons Paradox": cheaper inference leads to proportionally greater usage, sustaining total spend.
AI is mission-critical above a threshold price, making demand inelastic. T. Rowe Price estimates that above around $35/GPU-hour, enterprise demand for the most mission critical AI is effectively price-insensitive. The cost of falling behind is asymmetric – market leadership compounds. The penalty for underinvestment far exceeds the penalty for overinvestment.
We are also noticing interesting price dynamics in the AI supply chain. Price wars at the API (application programming interface) layer are not matched by price dynamics at the enterprise layer subscriptions or commitments. There is a clear bifurcation between API/token pricing (deflationary) and enterprise subscription/pricing (sticky to rising).
API/token price deflation
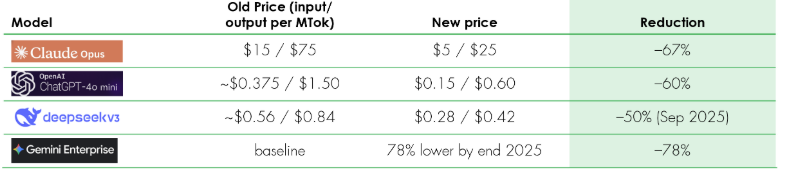
Source: IntuitionLabs LLM Pricing Report, February 2026; InfoWorld / Anthropic pricing disclosures, November 2025.
Raw API/token prices are in a deflationary spiral driven by compute efficiency and open-source competition. However, enterprise commitment values, seat-based subscription revenues and total cloud spend are all rising. The hyperscalers are capturing the value layer above raw model inference through platforms (Bedrock, Vertex AI and Azure AI Foundry), proprietary chips and integration into enterprise workflows.
The central question for investors remains whether the capex-to-revenue gap will close in favour of revenues. Pure-play AI vendor revenues (OpenAI has around $20 billion from ARR plus Anthropic has around $30 billion from ARR) represent less than 10% of the projected 2026 hyperscaler capex base. This hyperscaler capex spend, at about one-third of their total revenues, already exceeds the dotcom peak levels (around 32%), according to Morgan Stanley. The Goldman Sachs innovation cycle framework places AI in the "Appraisal/Hopes and Dreams" phase, which is most favourable for infrastructure investment and
valuation expansion but it is also the phase where expectations are most vulnerable to disappointment if monetisation lags.
We have made the point on many occasions that the current period is different from the dotcom boom/bust as there are plenty of mitigating factors to the risks. Balance sheets remain strong with Net Debt/EBITDA (earnings before interest, tax, depreciation and amortisation) around 0.3 times across the hyperscalers. All hyperscalers are reporting backlog growth accelerating faster than capex, and AWS, Azure and Google all reported margin expansion in AI cloud segments: Google Cloud operating income grew from $2.1 billion to $5.3 billion in a single year. This is very different from a 2000 backdrop of often no revenues and capex financed heavily by debt.
As stated above and explained by T. Rowe Price, the "competitive necessity" framing means companies cannot afford to under-invest even if near-term returns are uncertain.

Conclusion
The primary conclusion is that there is still uncertainty in the AI investment landscape. However, we are incrementally more positive on the revenue-generating potential given recent trends from both hyperscalers and intermediate providers like OpenAI and Anthropic.
Bull points
On the bull side of the argument, all hyperscalers are supply-constrained, not demand-constrained; backlog growth is outpacing capex. Enterprise AI adoption is accelerating rapidly (94% of companies plan continued investment and IT budgets are shifting towards AI). Jevons Paradox is at work with efficiency gains driving lower prices but higher volumes, thus sustaining revenue growth. Proprietary AI stacks (Google TPUs and AWS Trainium) are building durable competitive moats. The $625 billion Azure backlog, $240 billion Google Cloud backlog and $523 billion Oracle backlog represent real, signed future revenues.
Bear points
On the bear side, the key risk is the capex-monetisation gap that is wide, and the extent of its closure is totally unclear. Revenue revisions are lagging capex revisions and free cash flow is being squeezed. Capex/revenue ratios already exceed the dotcom peak, and the hyperscalers of today are as capital intensive as any smokestack industry of the past but with sufficient revenues still the missing link. It is likely that we won’t see the revenues needed to support the spend for at least two to three years and this is a vacuum which markets have to navigate. The depreciation of hyperscaler capex, at around $400 billion a year, will exceed their combined 2025 profits, which really is a calculated gamble.
In this seesaw environment, we believe the best investment options are those where the impact of whether revenue shows up in the required size or not doesn’t define the success of the investment. This implies that providers of bottleneck capex, like memory or hard disk drives, are well placed for the short to medium term at least. Operators that have other sources of revenue to cushion any revenue shocks in AI look good as well, with Amazon and Google being best placed here.
Read, watch and listen to more insights from Liontrust fund managers here >
KEY RISKS
Past performance does not predict future returns. You may get back less than you originally invested.
We recommend this fund is held long term (minimum period of 5 years). We recommend that you hold this fund as part of a diversified portfolio of investments.
The Funds managed by the Global Equities Team:
-
May hold overseas investments that may carry a higher currency risk. They are valued by reference to their local currency which may move up or down when compared to the currency of a Fund.
-
May encounter liquidity constraints from time to time. The spread between the price you buy and sell shares will reflect the less liquid nature of the underlying holdings.
-
May invest in smaller companies and may invest a small proportion (less than 10%) of the Fund in unlisted securities. There may be liquidity constraints in these securities from time to time, i.e. in certain circumstances, the fund may not be able to sell a position for full value or at all in the short term. This may affect performance and could cause the fund to defer or suspend redemptions of its shares.
-
May have a concentrated portfolio, i.e. hold a limited number of investments or have significant sector or factor exposures. If one of these investments or sectors / factors fall in value this can have a greater impact on the Fund's value than if it held a larger number of investments across a more diversified portfolio.
-
May invest in emerging markets which carries a higher risk than investment in more developed countries. This may result in higher volatility and larger drops in the value of a fund over the short term.
-
Certain countries have a higher risk of the imposition of financial and economic sanctions on them which may have a significant economic impact on any company operating, or based, in these countries and their ability to trade as normal. Any such sanctions may cause the value of the investments in the fund to fall significantly and may result in liquidity issues which could prevent the fund from meeting redemptions.
-
May invest in companies predominantly in a single country which maybe subject to greater political, social and economic risks which could result in greater volatility than investments in more broadly diversified funds.
-
May hold Bonds. Bonds are affected by changes in interest rates and their value and the income they generate can rise or fall as a result; The creditworthiness of a bond issuer may also affect that bond's value. Bonds that produce a higher level of income usually also carry greater risk as such bond issuers may have difficulty in paying their debts. The value of a bond would be significantly affected if the issuer either refused to pay or was unable to pay.
-
May, in certain circumstances, invest in derivatives but it is not intended that their use will materially affect volatility. Derivatives are used to protect against currencies, credit and interest rate moves or for investment purposes. The use of derivatives may create leverage or gearing resulting in potentially greater volatility or fluctuations in the net asset value of the Fund. A relatively small movement in the value of a derivative's underlying investment may have a larger impact, positive or negative, on the value of a fund than if the underlying investment was held instead.
The risks detailed above are reflective of the full range of Funds managed by the Global Equities Team and not all of the risks listed are applicable to each individual Fund. For the risks associated with an individual Fund, please refer to its Key Investor Information Document (KIID)/PRIIP KID.
The issue of units/shares in Liontrust Funds may be subject to an initial charge, which will have an impact on the realisable value of the investment, particularly in the short term. Investments should always be considered as long term.
DISCLAIMER
This material is issued by Liontrust Investment Partners LLP (2 Savoy Court, London WC2R 0EZ), authorised and regulated in the UK by the Financial Conduct Authority (FRN 518552) to undertake regulated investment business.
It should not be construed as advice for investment in any product or security mentioned, an offer to buy or sell units/shares of Funds mentioned, or a solicitation to purchase securities in any company or investment product. Examples of stocks are provided for general information only to demonstrate our investment philosophy. The investment being promoted is for units in a fund, not directly in the underlying assets.
This information and analysis is believed to be accurate at the time of publication, but is subject to change without notice. Whilst care has been taken in compiling the content, no representation or warranty is given, whether express or implied, by Liontrust as to its accuracy or completeness, including for external sources (which may have been used) which have not been verified.
This is a marketing communication. Before making an investment, you should read the relevant Prospectus and the Key Investor Information Document (KIID) and/or PRIIP/KID, which provide full product details including investment charges and risks. These documents can be obtained, free of charge, from www.liontrust.com or direct from Liontrust. If you are not a professional investor please consult a regulated financial adviser regarding the suitability of such an investment for you and your personal circumstances.
Understand common financial words and terms See our glossary


