


Active funds have struggled this year. In 16 of the 22 equity fund sectors in the Investment Association universe, the majority failed to beat the most common benchmark in their peer group.
Fund managers should theoretically thrive when volatility increases as they have the flexibility to invest anywhere – so they can avoid some of the biggest blow-ups in the market.
Conversely, index funds are forced to buy more of the largest constituents. While this works when markets rise, when they fall, they are exposed to the full force of the sell-off.
To put this to the test, Trustnet analysed the percentage of active funds in each IA equity sector that beat the most common benchmark. In the table below, the grey line represents the percentage of funds underperforming the benchmark and the blue line represents those outperforming.
We have filtered out the sectors for passive funds, leaving only the truly active managers in the study.
Active manager outperformance vs the benchmark YTD
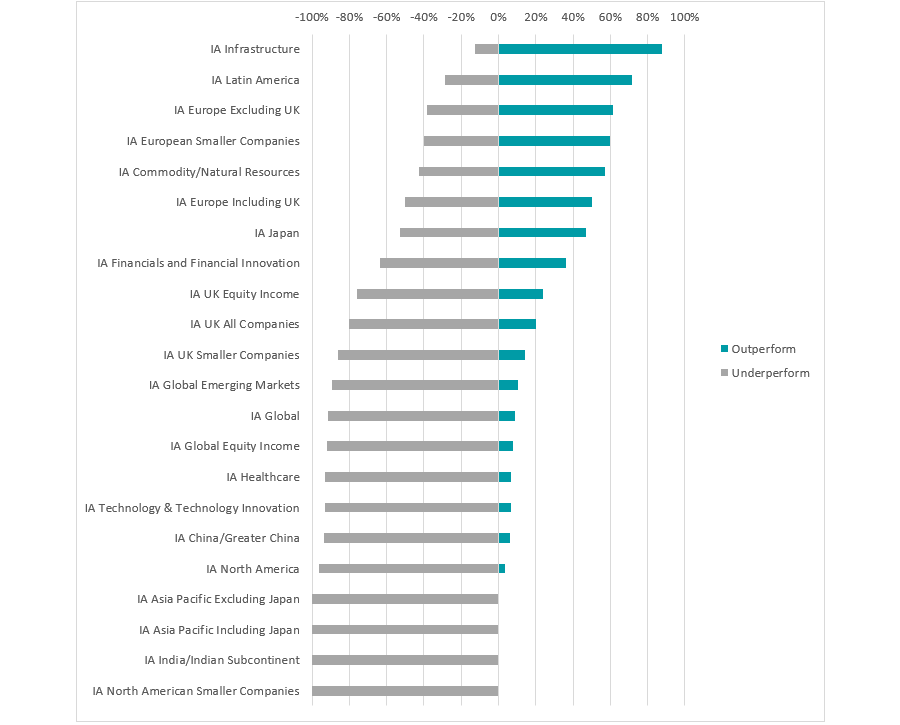
Source: FinXL, Data as of 12 August. Data in local currency terms.
Among the sectors with the lowest hit rate, IA Global stands out. It has been a poor year for broad equity markets, which have been hamstrung by their high weighting to the US. The S&P 500, which is up just 1.9%, has been a hindrance, causing the developed market-only MSCI World to make 4.8%.
For this study, we used the MSCI ACWI, which includes emerging markets and has performed slightly better, up 5.6%.
Some 91.3% of active funds couldn’t clear this hurdle, suggesting a high weighting to the formerly dominant US market, which has soured this year due to president Donald Trump’s unpredictable trade policies.
However, there is a silver lining. Laith Khalaf, head of investment analysis at AJ Bell, said Trump’s policies have provided a tailwind for certain active managers that are underweight the US.
For example, the $1.1bn Heptagon Kopernik Global All Cap Equity, a value fund with just 10% exposure to the US, is one of the best-performing active funds in the IA Global sector this year.
Closer to home, active managers also failed to beat the benchmark in the three UK peer groups: IA UK All Companies, IA UK Equity Income and IA UK Smaller Companies.
Between 76% and 86% of active funds underperformed in these peer groups. The former two were benchmarked against the FTSE All Share, while the latter was against the Deutsche Numis Smaller Companies Excluding Investment Companies index.
Khalaf attributed this poor performance to mid and small-cap stocks “lagging behind the big blue-chip FTSE 100”, as active managers tend to hunt further down the market-cap spectrum.
The large-cap index has delivered a 14.7% total return year-to-date, with the mid-cap FTSE 250 and small-cap Deutsche Numis Smaller Companies benchmark far behind.
Performance of indices YTD
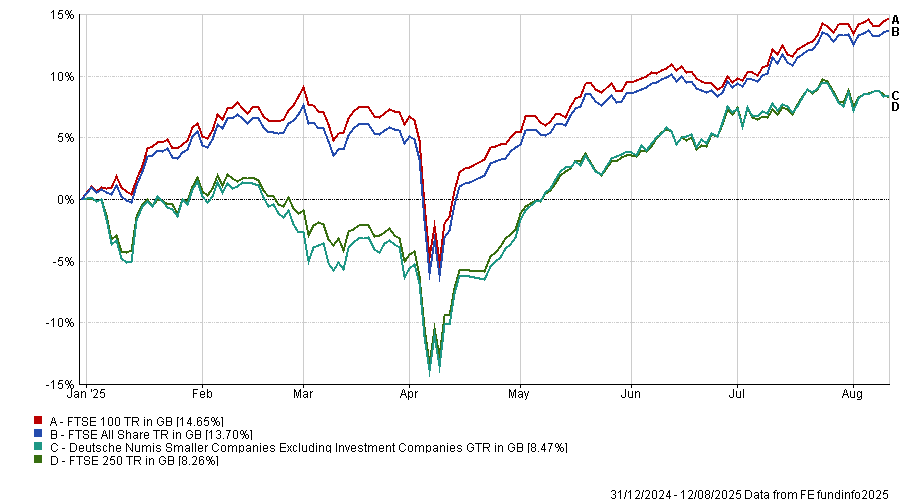
Source: FE Analytics. Data as of 12 August. Data in local currency terms.
However, these were not the worst sectors for active management. There were four peer groups where no funds beat the benchmark. These were: IA Asia Pacific excluding Japan, IA Asia Pacific including Japan, IA India/Indian Subcontinent and IA North American Smaller Companies sectors.
The outperformers
However, it has not been all doom and gloom for active management this year. European active managers have posted strong results, with 50% to 62% of active funds in the IA Europe including UK, IA Europe excluding UK and IA European Smaller Companies peer groups outperforming the most common benchmarks in their sectors (MSCI Europe, MSCI Europe ex UK and MSCI Europe Small Cap).
European indices have been one of the primary beneficiaries of investors' rotation away from the US as people have increasingly turned to value stocks.
Lower inflation, a reasonable economy and commitments for further government spending on infrastructure and defence have all attracted investors this year.
Performance of indices YTD
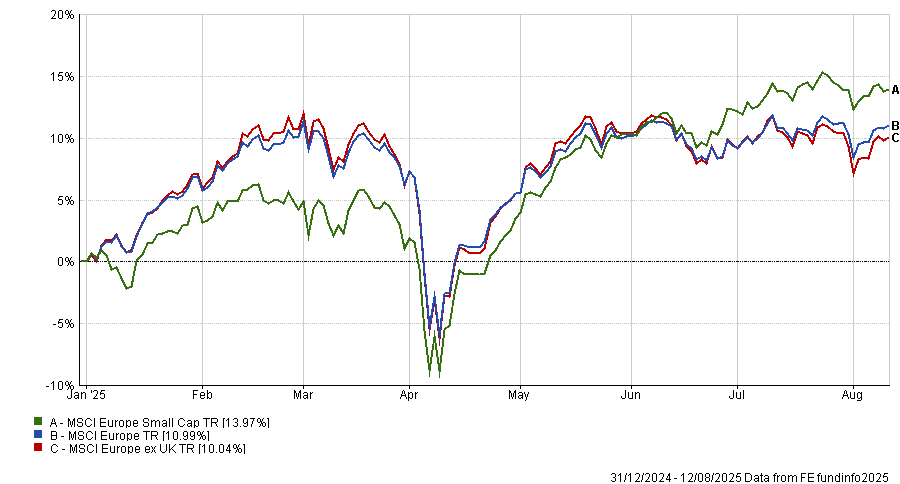
Source: FE Analytics. Data as of 12 August. Data in local currency terms.
Active managers have been able to outperform despite these indices rallying, as there has been a significant disparity in returns between different parts of the market. Stocks in the financials, utilities and telecom sectors have posted supranormal returns, disproportionately benefitting certain funds.
For example, Artemis SmartGARP European Equity, with its 42% exposure to financials, has outperformed the MSCI Europe ex UK by 31.2 percentage points.
However, Europe was not the top place for active management in 2025. Some 88% of the IA Infrastructure sector beat the most common benchmark, topping the list. In second place was IA Latin America (71.4%).