


Stagflation fears are rising sharply but the historical record suggests investors who retreat from equities entirely may be making the wrong call, according to Schroders head of strategic research Duncan Lamont.
Stagflation is an economic environment where growth is weak and inflation is high. Lamont defined it as real GDP growth falling below the previous 10-year average while CPI inflation rises above it, using rolling averages rather than fixed thresholds because what counts as high inflation or low growth shifts with the economic climate of the time.
With the oil price spiking after Iran effectively closed the Strait of Hormuz during its conflict with the US and Israel, worries that the global economy is heading towards stagflation have returned.
The economic anxiety is straightforward: when demand is already weak, companies struggle to pass higher input costs on to customers, so profit margins absorb the hit instead. Central banks then face an unenviable choice: cut rates to support growth and risk stoking inflation further or hold rates high and risk deepening the slowdown.
The latest Bank of America Global Fund Manager Survey found that stagflation is now the dominant macro expectation among asset allocators, with 51% predicting this over the coming 12 months.
Fund managers’ economic expectations
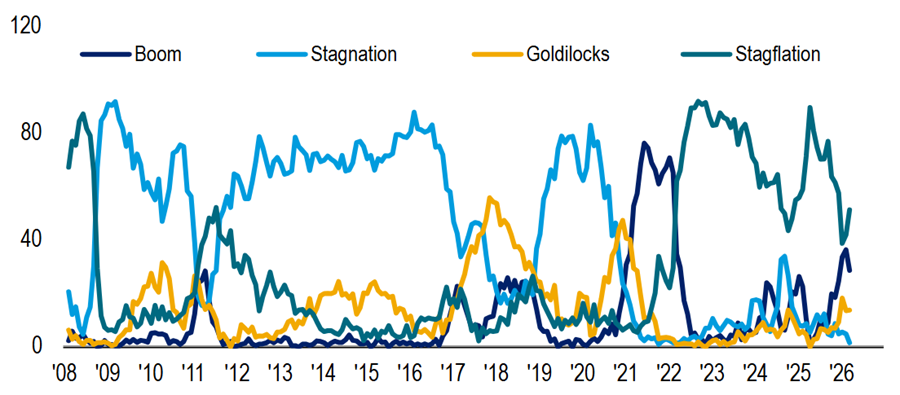
Source: BofA Global Fund Manager Survey, Mar 2026
Drawing on nearly 100 years of US equity data from 1926 to 2025, Lamont said: “On average, this is the worst kind of environment for the stock market. But investors need not panic.
“Our analysis shows that stocks often perform well when there is stagflation, just not as well as at other times.”
The median real return for equities in a stagflation year has been approximately 0%. In roughly half of the 17 stagflation years identified, however, stocks delivered a positive real return, averaging 16% when positive (but down 14% when negative).
US real equity returns when inflation and growth are above/below their 10-year average, 1926-2025 calendar year data (number of occurrences in brackets)
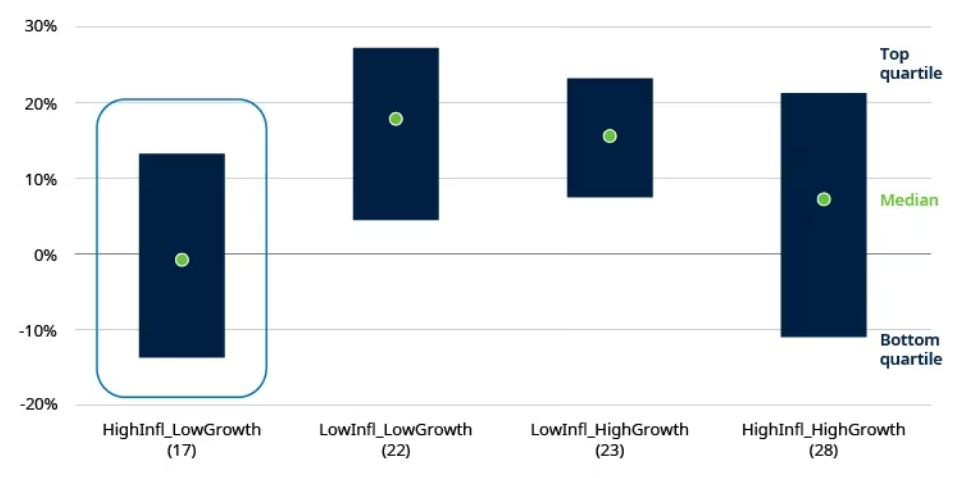
Source: Morningstar Direct, accessed via CFA institute, LSEG Datastream, S&P, and Schroders
Equities outperformed cash in 10 of those 17 years and Schroders’ statistical tests found no significant difference between equity-versus-cash performance during stagflation and all other periods.
“Getting close to inflation in a high inflation environment is not a bad outcome,” Lamont said.
Lamont also addressed whether the positive years were simply rebounds from prior crashes. In most cases, good stagflation-era returns followed years when real returns were already positive.
Rate cuts were not the trigger either: in 1979, 1980 and 2006, rates were raised; in 2007, they were broadly flat.
“There is no historical reason why investors should expect stocks to fall, even if we do enter stagflation,” he said. “There can be lower conviction of strong returns but predicting doom is not appropriate either.”
Calendar years when inflation was above and growth below their 10-year averages, 1926-2025
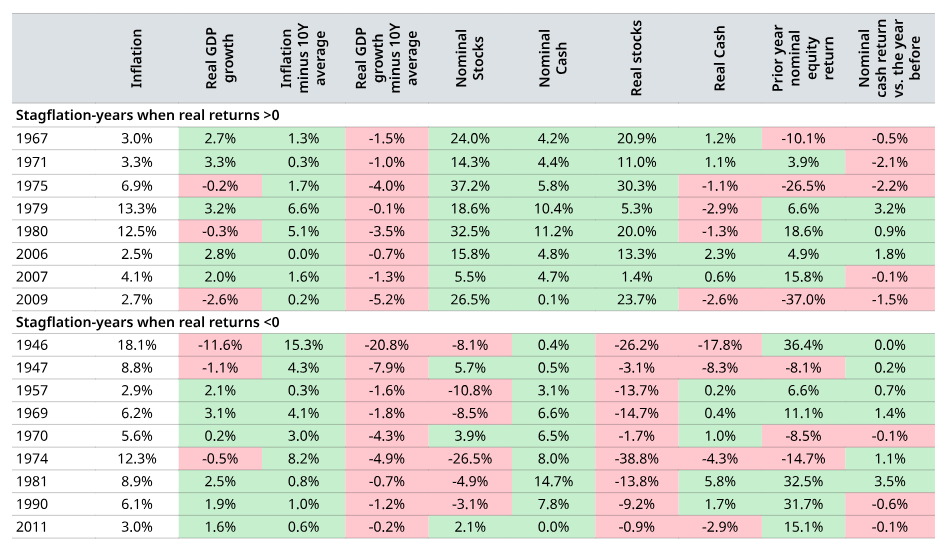
Source: Morningstar Direct, accessed via CFA institute, LSEG Datastream, S&P, and Schroders
Which sectors hold up and which do not
Sectoral data covers 1974 to 2025 (reducing the number of stagflation-years to analyse) and requires a qualitative overlay, Lamont explained. Sector compositions have shifted substantially; for example, Alphabet and Meta now account for nearly three-quarters of the communication services sector by market capitalisation, making direct historical comparisons imprecise.
With that caveat, the patterns are largely intuitive. Energy and materials have typically performed well because commodity price rises have often been the cause of elevated inflation during stagflation. Utilities and consumer staples have held up as demand for their products is less sensitive to economic cycles.
Information technology and consumer discretionary have struggled. Growth-oriented technology stocks carry high price-to-earnings ratios, and rising interest rates compress the present value of future earnings, hitting them particularly hard.
“This is also relevant for today’s crop of communication services companies,” Lamont said, though he noted that many of the largest are now highly profitable with strong balance sheets, distinguishing them somewhat from historical comparators.
US sectoral real equity returns when inflation is above and growth below its 10-year average, 1974-2025, calendar year data
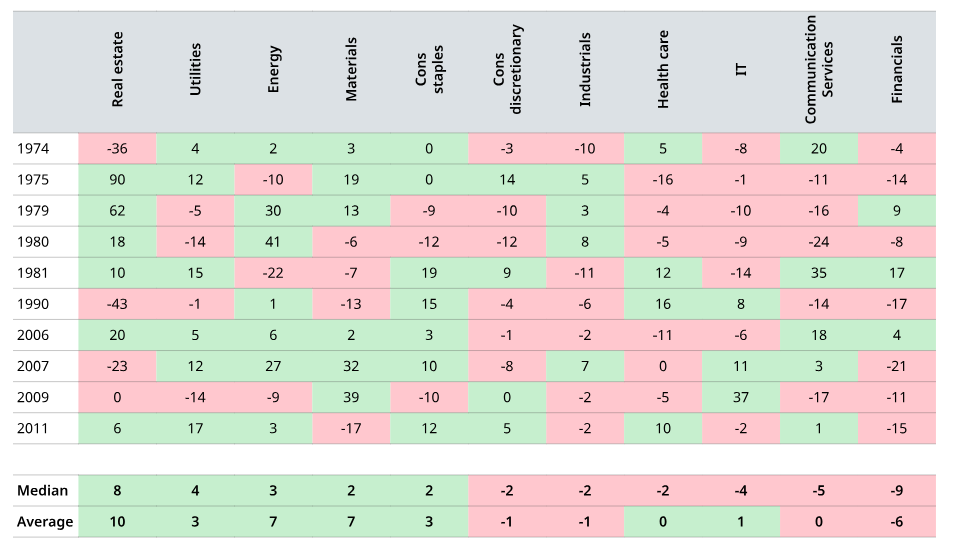
Source: LSEG Datastream and Schroders. Figures are shown on a rounded basis.
Financials have also fared poorly, as stagflation often inverts yield curves and squeezes bank profitability. Lamont acknowledged that yield curves have been steepening recently, supporting the sector, but warned that “serious growth concerns could easily lead to tumbling longer-term yields, putting this performance at risk”.
On healthcare, extending the analysis back to 1927 shows a longer-term median outperformance of around 4% to 5%, more consistent with its defensive reputation than the post-1974 record alone suggests.
Which markets are best and worst placed
Regional market composition determines stagflation exposure in ways that matter considerably to investors.
The US stands out as the most vulnerable of the major markets as its index carries a heavy weighting to IT and communication services, while its combined allocation to historically more resilient sectors totals only around 15%.
“The US does not look like a candidate for strong performance if stagflation becomes a reality,” Lamont warned.
The UK presents a more interesting case. Its 16% weighting in consumer staples and 10% in energy are more than double any other major market's allocation to either, exposure to IT and communication services is minimal, and the market remains cheaply valued relative to peers.
“There is definite potential for negative perceptions about the UK market’s boring, defensive, nature to turn to its advantage,” Lamont said.
Europe’s large industrials weighting looks like a headwind, but Germany’s plans to borrow for defence and infrastructure spending should support that sector. Overweights to utilities and underweights to IT strengthen the case, though financials remain a watch item.
Japan looks poorly positioned; industrials and consumer discretionary combined account for 44% of the MSCI Japan index, with no meaningful overweights to more resilient sectors.
Emerging markets face similar structural headwinds through overweights in consumer discretionary, communication services and financials.
Lamont said the implications are particularly stark for passive investors.
“Investors passively tracking the global market could find this uncomfortable, given the MSCI World index has 70% in the US and MSCI ACWI has 62%," he argued. “As correlations among stocks fall and dispersion in returns rise, the potential for active managers to add significant value should rise with it.”