


The odds of selecting the best-performing asset class every year for a decade one in 107 billion – roughly the same as winning the National Lottery jackpot nearly 2,400 times in a row, according to analysis by Murphy Wealth.
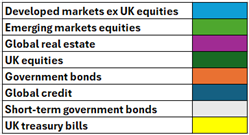
The wealth manager's study of data from Dimensional Fund Advisors tracked eight asset classes over 10 years and found five different areas topped the annual rankings over the period.
But predicting which one will win in any given year is an insurmountable challenge – even when the starting point isn’t the entire universe but just eight asset classes within it. In fact, a saver would be equally likely to win £1m from Premium Bonds on 41 separate occasions.
Adrian Murphy, chief executive of Murphy Wealth, said: "Trying to pick the stock or even market with the highest return is speculation, rather than investment. Five years is the minimum time horizon for investing, but realistically a decade or longer is better – and the odds of selecting the best performers over that type of period are astronomical."
The table below shows just how frequently different assets classes have rotated into and out of the top spot.
Total return for each asset class 2011-2025
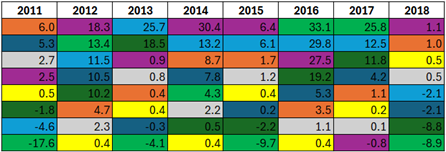
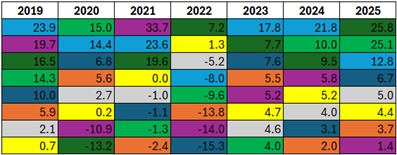
Source: Murphy Wealth
As an example, emerging market equities led the table three times in the past decade, returning 33.1% in 2016, 25.8% in 2017 and 15% in 2020, but also finished bottom twice, with losses of 8.9% in 2018 and a return of just 4% in 2023.
Neither global credit, short-term government bonds nor UK treasury bills appeared at the top of the table at any point over the 15-year period covered by the full dataset.
Investor who tried to call the best asset class had a particularly unlucky year in 2021, when the difference between the best and worst performing asset class was 36.1% (33.7% for global real estate and -2.4% for government bonds) versus a 10-year average of 23.7%. The lowest dispersion was 10 percentage points in in 2018 (1.1% for global real estate and -8.9% for emerging market equities).
According to Murphy, the pattern is yet another reason against concentrating exposure in any single asset class.
“People often like to think they can pick out the best-performing company on the stock exchange but these figures show it’s a fool’s game – particularly during uncertain periods like the one we are going through at the moment,” he said.
"What is in favour today can easily become massively unpopular tomorrow. The right spread of investments will make sure you remain focused on your long-term goals and shield you from short-term noise.”