


Active funds have been hit with larger losses than their passive rivals in the 2025 market downturn, FE Trustnet research has found, despite arguments that active management can help to avoid the worst of sell-offs.
Global stocks have been trending downwards for most of the year, on the back of concerns around trade tariffs from the new US administration, rising recession risks and expensive but concentrated markets.
The MSCI AC World index fell 16.7% in sterling terms between its peak on 22 January and 22 April 2025. This decline was led by a sell-off in the US, after the US exceptionalism narrative started to crack and investors rotated away from the world’s largest economy.
Performance by geography between 22 Jan and 22 Apr 2025
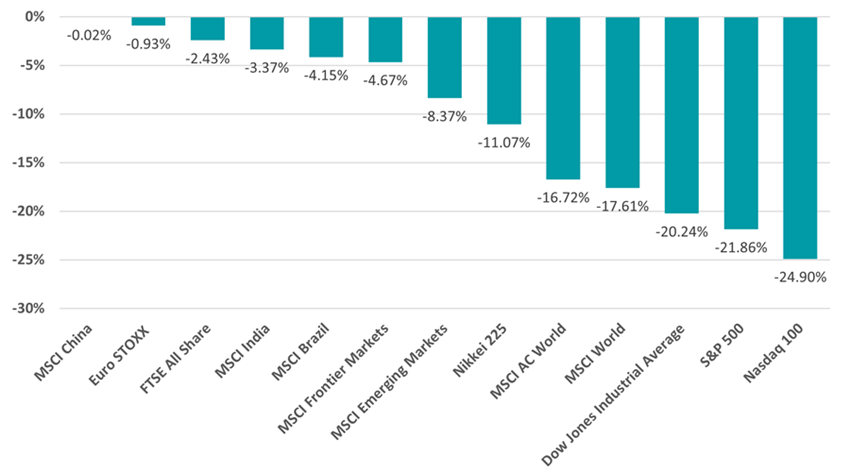
Source: FinXL
Active managers often argue they have a better chance of limiting losses in market downturns, thanks to the flexibility they have to adjust holdings or raise cash. In theory, this allows active funds to avoid the worst-hit sectors and respond faster than passive strategies locked into index weightings.
In practice, many active managers fail to deliver consistent downside protection when it matters most. Poor timing, market misreads and concentrated bets often leave active funds exposed to the same declines as the market, or worse.
FE Trustnet research suggests this has been the case over 2025, as the average active fund in most sectors has made a lower return than their passive counterpart. As shown in the chart below, active funds have underperformed passive in 32 sectors in the Association Universe, while they have outperformed in just 17.
Performance of average active and passive funds between 22 Jan and 22 Apr 2025
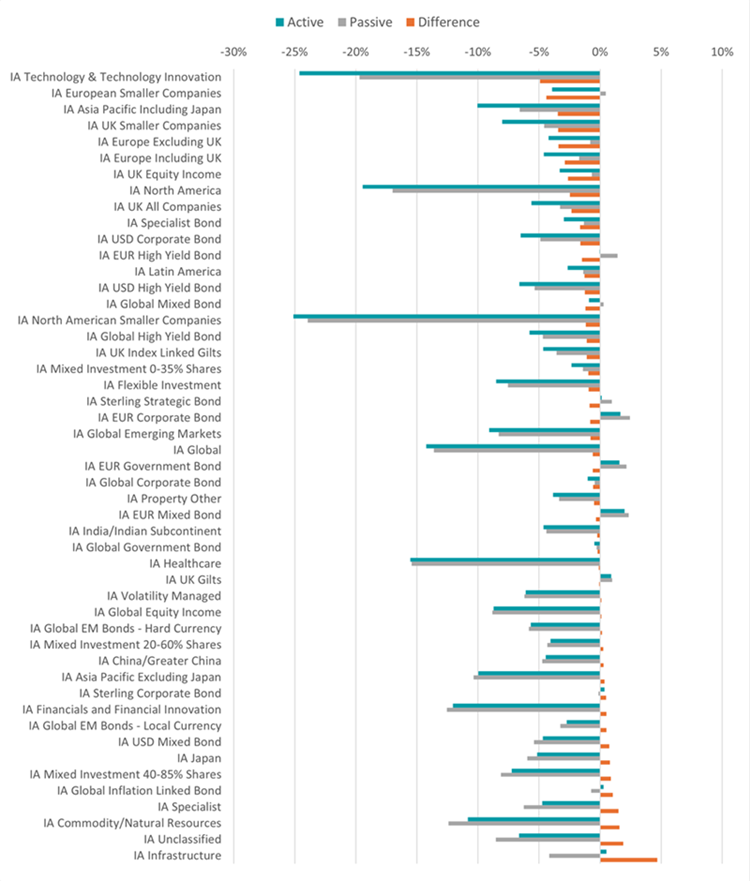
Source: FinXL
The chart’s teal line shows the total return of the average active fund in each sector while the grey line shows the average passive fund. The orange line is the difference between the two types of fund.
Active funds in the IA Technology & Technology Innovation sector have put in the worst showing: their average loss of 24.6% is almost 5 percentage points higher than the 19.7% fall from the average passive.
Tech stocks have been at the epicentre of the sell-off. Mega-cap US tech names such as Tesla, Nivida and Amazon (three of the ‘Magnificent Seven’) have led the market for several years but have fallen hard after worries about an economic slowdown caused investors to avoid expensive stocks.
In light of this, active fund Liontrust Global Technology has been the worst performer in the IA Technology & Technology Innovation sector over 2025, falling 31.6%. Tesla, which has fallen 45% (in US dollars) since 22 January, is the fund’s largest holding.
Other active tech funds posting heavy losses this year include AB International Technology Portfolio (down 30.6%), Polar Capital Global Technology (down 29.1%) and Herald Worldwide (down 28.3%).
On the other hand, the peer group’s seven best performers are all index trackers, including SPDR MSCI Europe Communication Services UCITS ETF – the only member of the sector to make a positive return this year.
Active funds investing in European stocks – an area where investors have been more positive on given the volatility around the US market – have also struggled relative to their passive peers.
Of the 20 European equity funds with the biggest losses this year, 18 are active strategies and are down by more than 10%. BlackRock Continental European fared the worst, losing 15.1%, followed by Premier Miton European Opportunities and Allianz Europe Equity Growth Select.
Meanwhile, 15 of the top 20 European funds are passives, led by SPDR MSCI Europe Utilities UCITS ETF and its 15.8% total return.
In the three UK equity sectors – IA UK All Companies, IA UK Equity Income and IA UK Smaller Companies – the 90 worst funds are all active. IFSL Marlborough Multi-Cap Growth made the biggest loss, down 17%, followed by SVS Dowgate Wealth UK Small Cap Growth, FP Octopus UK Micro Cap Growth, abrdn UK Value Equity and Unicorn UK Smaller Companies.
However, some active UK funds have held up in the sell-off. Admittedly, the best UK equity fund is passive (iShares UK Dividend UCITS ETF, up 3.3%) but the next eight are active. CT UK Monthly Income, RGI UK Equity Income, Artemis SmartGARP UK Equity and Rathbone Income are among them and the only other funds to be in positive territory.
IA North America is another sector where active funds have made higher losses than passives in the 2025 downturn, shedding 19.4% versus a fall of 17% from the average tracker.
Here, 19 funds have lost more than 25% since 22 January and 14 of those are active. Lazard US Equity Concentrated’s 30.1% loss is the largest in the sector, followed by Fisher Investments Institutional US Small and Mid-Cap Core Equity and iMGP US Small & Mid Company Growth.
In contrast, the best funds in the sector (although all have a made a loss) tend to be passives, led by ETFs investing in consumer staples and low volatility stocks.