


Investors are often told that higher risk brings higher reward but the past year has shown this rule does not always hold true.
FE Analytics data of sector performance versus volatility over the 12 months ending July 2025 revealed that, in some cases, the least volatile funds delivered stronger returns on average than their most volatile counterparts.
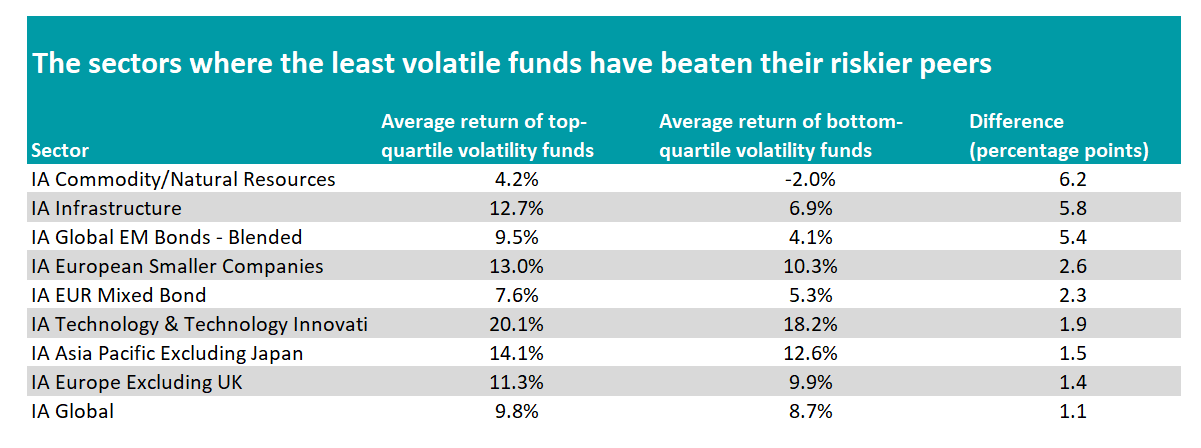
Below are the average returns of the sectors with the widest difference in performance between the most and least volatile funds, with the least volatile delivering stronger total returns.
Source: FE Analytics
For the IA Global sector, the 25% least-volatile funds delivered an average 9.8% total return, whereas the 25% most-volatile funds in the sector made an average gain of 8.7% over the past year.
The least volatile fund in the sector was the $613.6m JGF-Jupiter Global Value fund, which delivered a total return of 16.9% over the assessed period, with volatility of 7.4%.
Growth stocks have made better returns but have been significantly more volatile over the past year. This fund has managed to give investors the sweet spot of above-average performance with limited risk.
The list of the least-volatile funds, however, is a mixture of funds, showing how varied the market has been over 12 months.
Among the least risky funds, fellow value fund Artisan Global Equity topped the performance table with a 32.4% gain. In second place was the quality-growth portfolio WS Blue Whale Growth (28.9%) and in third came small-cap specialist Overstone UCITS Global Smaller Companies (27.9%).
The biggest disparity in returns however came from the IA Commodity/Natural Resources sector. Funds in this peer group invest in a range of different commodities which are closely tied to inflation, interest rates, geopolitical events and supply-demand imbalances – but not all move as one.
As such, funds targeting gold outperformed over the assessed period compared to others focused on the likes of timber, clean energy and oil.
Over the 12-month period ending July 2025, the least volatile funds in the IA Commodity/Natural Resources sector averaged a 4.2% gain, whereas the most volatile averaged a 1.9% loss.
However, the average in the top quartile was likely skewed by the outperformance of UBS Solactive Global Pure Gold UCITS ETF, which benefitted from the gold boom and managed a 53.8% total return over the assessed period, with a volatility of 12.6%.
The fund tracks the performance of the Solactive Global Pure Gold Miners Net Total Return Index, which targets large companies generating at least 90% of their revenues from gold mining.
The fund with the lowest cumulative volatility in the sector (10%) was GMO Resources UCITS, which made a loss of 12.5%.
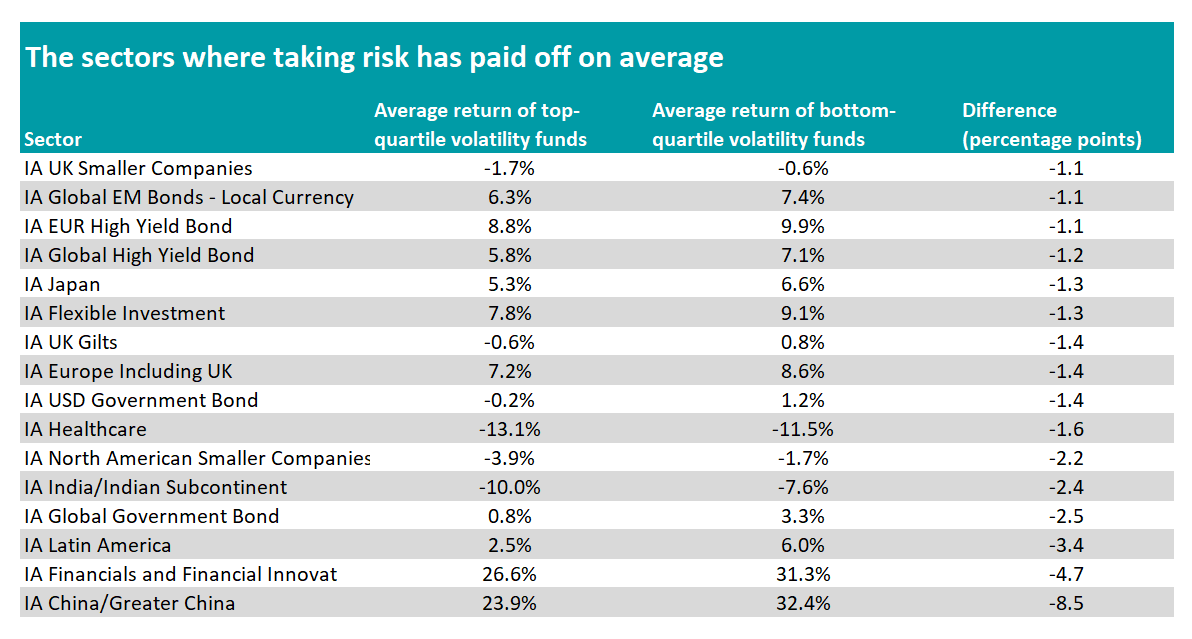
There were sectors where taking on more risk paid off, however. Funds in IA China/Greater China, for example, fit the bill.
The sector is known for its high volatility, which has been exacerbated in recent months by ongoing uncertainty surrounding US-China trade relations.
With China’s markets rebounding strongly, higher volatility funds stood to benefit most. As such, the 25% most volatile funds in the sector delivered an average 32.4% total return over the 12-month period – 8.5 percentage points more than the least volatile funds.
Source: FE Analytics
Even the least volatile funds in the sector were more volatile compared to other sectors. The £87.2m Jupiter China fund ranked in the first quartile for both cumulative performance and volatility (meaning it was one of the least volatile). It delivered a 49.9% total return over the assessed 12-month period against volatility of 18.8%.
Others, like Matthews China, managed a 38.4% total return over the same period with much higher volatility of 29.9%.
Meanwhile, it has been a difficult few years for small-cap funds around the world, with smaller companies consistently outperformed by large-cap stocks.
In the UK, the lower end of the market has languished due to economic stagnation, while large-caps have benefited from investors seeking out more defensive and value-driven stocks.
In the US, the market has long been dominated by large-caps with significant global exposure, tech dominance and low interest rates.
When comparing the two sectors at a high level, they tell a similar story. The least volatile funds in IA UK Smaller Companies lost an average of 1.7% over 12 months compared to a 3.9% loss for IA North American Smaller Companies.
In both cases, the 25% most volatile funds fared better on average, delivering a 0.6% and 1.7% loss respectively.
However, when looking at individual fund performance, IA North American Smaller Companies funds typically had higher volatility for very similar levels of returns as the UK sector.
Abrdn SICAV I – North American Smaller Companies featured in the top 25% least volatile funds in the sector (20.2%). It made a 6% return over the 12 months.
CT US Smaller Companies was one of the most volatile funds in the sector at 27.1%. It managed a top quartile performance with a 1.9% total return.
For the UK sector, WS Raynar UK Smaller Companies was one of the least volatile (9.3%) and delivered an 8.4% return over the 12-month period ending July 2025, while Schroder UK Smaller Companies managed a 3.9% return with 14.4% volatility.
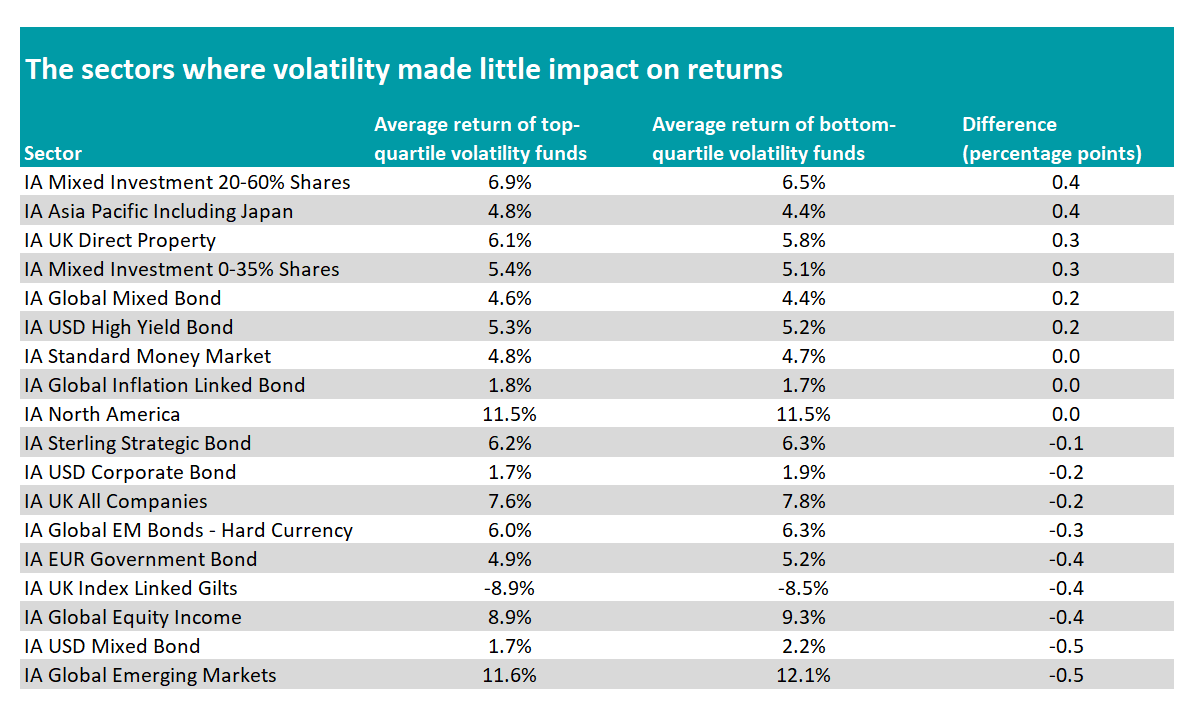
There were also several other sectors (listed below) where returns remained fairly balanced across the volatility spectrum.
Source: FE Analytics
IA Standard Money Market, IA Global Inflation Linked Bond and IA North America, for instance, had near identical total returns across the least volatile and most volatile funds.
Here, investors may have preferred the smoother ride for similar returns but were not disadvantaged overall by taking on more or less risk.