


Multi-manager funds generally dominated the list of top-performing high-cost portfolios in the four main Investment Association (IA) multi-asset sectors over the past five years, Trustnet research has found.
With almost 600 funds to choose from, some investors may choose low-costs options as charges are one of the biggest detriments to returns. However, costs aren’t everything and some funds that charge more have made exceptional returns despite higher fees.
As part of an ongoing series, Trustnet examines the funds in each sector that have posted top-quartile returns over the past five years, with relatively expensive ongoing charges figures (OCF) of above 1%. Today, we examine the four main multi-asset sectors.
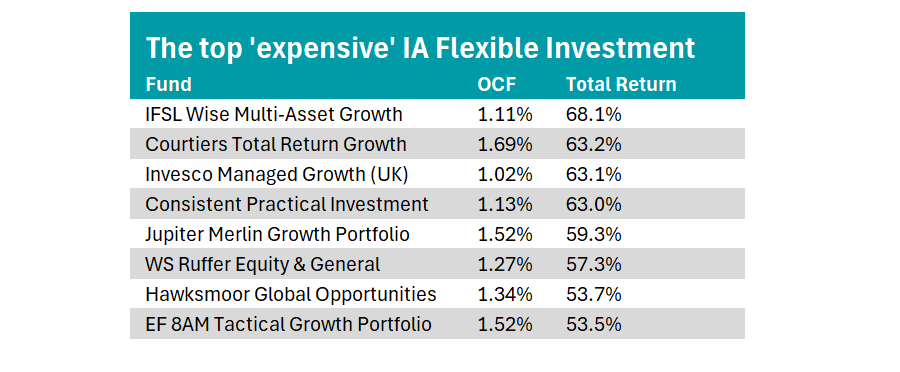
IA Flexible Investment
In the IA Flexible sector, where managers are completely unconstrained, IFSL Wise Multi-Asset Growth fund took the crown for best performance with a total return of 68.1% after deducting its 1.11% OCF.
Source: FE Analytics
Led by Vincent Ropers and Phillip Matthews, it is a multi-manager approach that buys funds and trusts in “out of favour areas” to generate growth.
Around 50% of the portfolio is allocated towards stocks, followed by alternatives at 33.3% and 8.3% in bonds. Its top holding is the Worldwide Healthcare Trust followed by smaller companies specialist Odyssean and healthcare trust International Biotechnology, which make up the top three positions.
The allocation to alternatives has been a strong contributor to the fund so far this year, with holdings such as Jupiter Gold and Silver benefiting from the rally in the precious metal.
For investors who may prefer the safety of a larger team and fund, the £1.7bn Jupiter Merlin Growth Portfolio also appeared on the list.
Led by FE fundinfo Alpha Manager John Chatfeild-Roberts and his team, it is another fund of funds strategy with around 10-20 holdings in other portfolios.
Analysts at Titan Square Mile, which has awarded the fund with an ‘AA’ rating, said it is a significantly different portfolio to many competitors, due to the team's “common-sense” approach, leading them to avoid more complex forms of investment.
This approach has resulted in a 59.3% five-year return after fees, despite a 1.52% OCF.
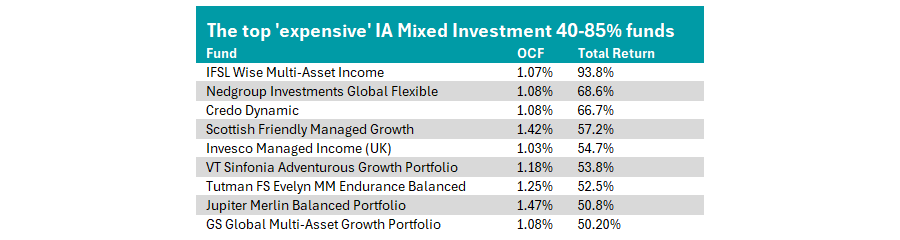
IA Mixed Investment 40-85% Shares
In the highest banded equity sector, investors had nine options in the IA Mixed Investment 40-85% shares sector that combined an OCF of above 1% with a top-quartile performance after fees.
Source: FE Analytics
Another multi-manager fund from the team at Wise Funds outperformed in this sector, with the IFSL Wise Multi-Asset Income fund up 93.8%, despite an ongoing charge of 1.07%.
This portfolio is less equity-heavy than its stablemate, with just 35% in stocks and a much greater allocation towards fixed interest and property. This allocations means it falls below the sector’s minimum equity exposure, but may still qualify given its preference for investment trusts, which could count towards an equity allocation despite investing in alternative assets.
FundCalibre, which added the strategy to its Elite Radar earlier this year, said: “We like the team’s straightforward process and focus on managers with a simple, yet disciplined investment approach.”
Analysts praised the managers’ willingness to use investment trusts to “tap into value opportunities” in regions or sectors considered unfashionable. However, they noted that the emphasis on out-of-favour areas can cause performance to take longer to come through.
Other top options in the sector include Nedgroup Investments Global Flexible, Credo Dynamic and Jupiter Merlin Balanced.
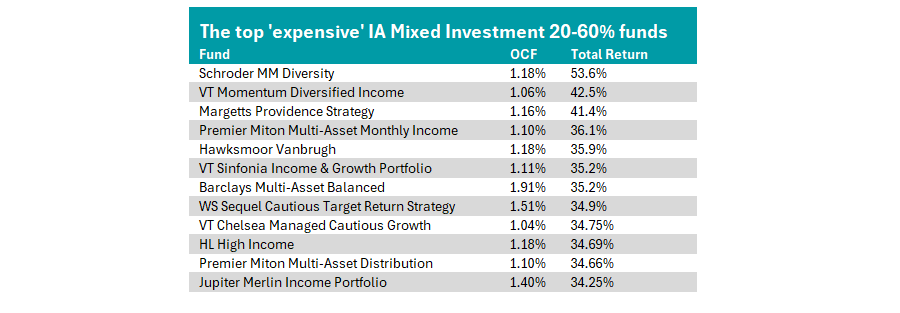
IA Mixed Investment 20-60% Shares
For those seeking a more balanced portfolio of bonds and equities funds of funds also led the pack in this sector, with Robin McDonald’s Schroder MM Diversity portfolio up 53.6% over the past five years, with an OCF of 1.18%.
Source: FE Analytics
It allocates to three main ‘buckets’ – equities, fixed income/cash and alternatives – with the neutral position being a third in each.
Analysts at Rayner Spencer Mills Research (RSMR) said the fund is “very different to traditionally managed strategies, in that it aims to beat inflation over the medium to long-term rather than any specific benchmark”. This goal is “in line with many investors' investment objectives”, analysts added.
While they noted that the unwillingness to increase the equity allocation beyond a third can cause some underperformance, it is a “good solution” for more cautious investors that still want some level of growth, analysts said.
Other top options here included VT Momentum Diversified Income, Margetts Providence Strategy and HL High Income.
IA Mixed Investment 0-35% Shares
Finally, we turn to the most cautious mixed asset sector, where equity allocation is capped at 35% of the portfolio. Top of the list in this sector is Chris Ainscough and Morgan Bocchietti’s Charles Stanley Monthly High Income fund.

Source: FE Analytics
More than 60% of the total portfolio is invested in government and corporate bonds, with the rest invested in equities and alternatives, including some exposure to other funds, such as Schroder Asian Income.
Other holdings in its top 10 include a 4.9% allocation towards cash, the highest absolute position in the portfolio.
Its 1.11% cost makes it a relatively expensive option in the sector but it has delivered a 19.3% total return, the fifth-best performance in the peer group.
Other expensive options to beat their peers include the VT Brompton Cautious fund (up 19.2%) and IFSL Church House Tenax Multi-Asset strategy (up 17.4%).
Previously in this series, we have examined the Global, US, UK and European markets.