


Multi-asset portfolios are usually designed as diversified one-stop shops that mitigate risks and behave differently than the overall market. Yet these funds have shown a high correlation to the S&P 500 over the past three and five years, data from FE Analytics shows.
This means that the average multi-asset fund has grown and fallen in tandem with the US market most of the time, leaving those who own both (as many DIY and beginner investors do) with synchronous gains and losses, to a level they might not have expected.
As investors are now increasingly aware of how exposed their portfolios truly are to the risks in the US market, this article reveals the Investment Association sectors that had highest and lowest levels of correlation to the American market over the past five years, to see which have provided on average better diversification.
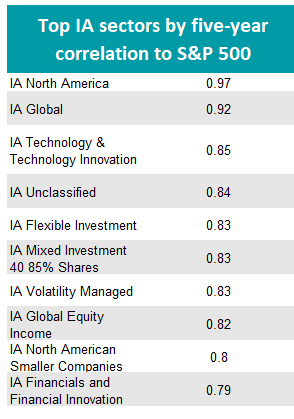
Of course, the IA North America sector has the highest correlation with the S&P 500, at 0.97, as would be expected. Not only do its members tend to focus on the US over Canada, but around a fifth of funds are index trackers.
Technology mega-caps make up a vast part of the S&P 500, with just the top five names (Nvidia, Microsoft, Apple, Alphabet and Amazon) representing around 30% of the index. In turn, the US market constitutes about 70% of the global market.
It is therefore unsurprising that the fund sectors with the highest correlation to the US beyond IA North America were IA Global (0.92) and IA Technology and Technology Innovation (0.85).
Source: FE Analytics
These were followed by the IA Unclassified sector (0.84). Although this is not an homogeneous peer group, as it is home to funds that do not easily fit into other sectors, it does hold many strategies with a pure equity or equity-heavy mixed asset approach.
Just below was the multi-asset IA Flexible Investment sector. Here, fund managers can allocate freely across asset classes, meaning they often aim at the higher returns that equities can provide, potentially explaining the high correlation to the US equity market.
The average multi-asset flexible fund has a correlation of 0.83 with the S&P 500 over the past five years. The figure remains the same in the IA Mixed Investment 40-85% sector, where equities can’t exceed 85% of portfolios.
The same was also true for the IA Volatility Managed sector, another multi-asset sector with the objective to manage returns while maintaining specified volatility parameters.
IA Global Equity Income, IA North American Smaller Companies and IA Financials and Financial Innovation completed the top 10 of sectors with strong correlations to the index.
The IA Mixed Investment 20-60% Shares and 0-35% Shares sectors also were highly correlated, at 0.77 and 0.71 respectively.
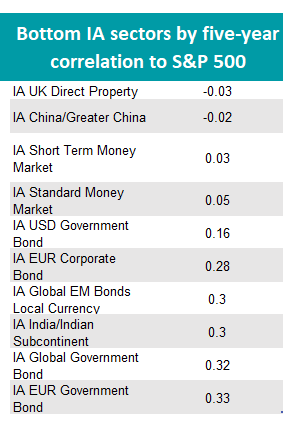
The only equity sector with a negative correlation to the S&P 500 was IA China/Greater China, with the average fund growing when the US fell and vice versa, to the beat of a -0.02 correlation.
UK direct property strategies were even less correlated at -0.03, highlighting the potential diversification benefits of alternatives such as real estate.
Money market funds were also at the foot of the table, at between 0.03 and 0.05, as illustrated below.
Source: FE Analytics
Funds investing in government bonds of different regions (including US, Europe and emerging markets) were sandwiched in the middle of the table, with levels of correlation spanning 0.16 and 0.33.
UK gilt funds were the outlier: at 0.51 correlation, they moved together with US equities over half the time – slightly more than global corporate bonds funds, which averaged at about 0.50.
Other equity sectors with low correlations were IA India/Indian Subcontinent (0.3), IA Latin America (0.38%) and IA Asia Pacific Excluding Japan (0.45). Europe and Japan were in the middle ground, at 0.65 and 0.6 respectively.
The data in this study applies at broad sector level, illustrating of how funds have behaved on average in the past five years. From next week, we will continue this correlation study at a funds level, revealing which strategies were able to buck the trend of their wider peer group.