


Multi-asset funds are often chosen by investors for their promise of smoother returns and diversification away from equity leadership, yet Trustnet’s latest correlation study shows how differently those promises have played out across the IA Mixed Asset universe.
After last week’s analysis of the IA Flexible Investment sector, today’s study is a follow-up that looks at the IA Mixed Assets 0-35%, 20-60% and 40-85% Shares peer groups to identify the strategies that have moved least – and most – in line with the S&P 500 over five years.
Correlation does not indicate whether a fund outperformed or lagged the S&P 500 – it shows the direction and consistency of the relationship between the two sets of returns. A high correlation suggests that a portfolio will move in the same direction as the S&P 500, while lower correlation scores show that a fund moved in materially different directions to US equities.
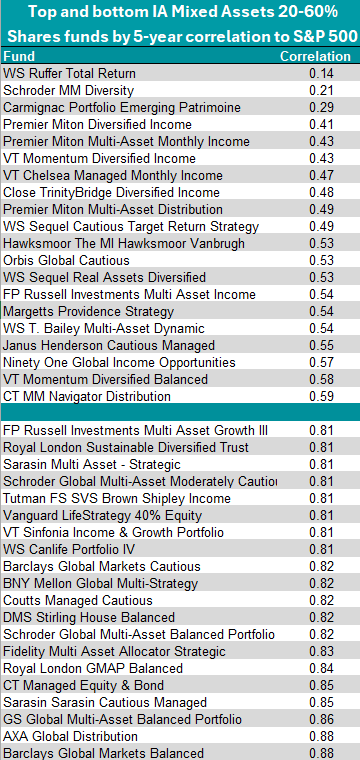
IA Mixed Asset 20-60% Shares: the widest dispersion
The 20-60% sector contained some of the clearest outliers across the entire study. WS Ruffer Total Return recorded a five-year correlation of 0.14, the lowest among all mixed-asset funds.
This strategy invests in inflation-protecting assets such as gold and was among the most sold funds of the 2024, before its asset class rallied this year.
Schroder MM Diversity followed at 0.21, which featured on Trustnet last month as an expensive multi-asset fund that justified its costs, with Carmignac Portfolio Emerging Patrimoine (0.29) in third place.
These three funds moved in a notably different pattern to the S&P 500, reflecting how their positioning translated into return paths with very limited overlap to US equity trends.
Source: FE Analytics
At the other end of the spectrum, AXA Global Distribution and Barclays Global Markets Balanced both stood at 0.88, placing them among the strongest US-linked profiles in the sector. GS Global Multi-Asset Balanced Portfolio (a fund highlighted for its strong Sharpe ratio) was only slightly below at 0.86, followed by CT Managed Equity & Bond at 0.85, which was deemed ‘poor value’ for investors in Columbia Threadneedle’s report of last April.
These figures indicate a far closer relationship to the S&P 500’s direction, meaning they move more in line with the index than peers.
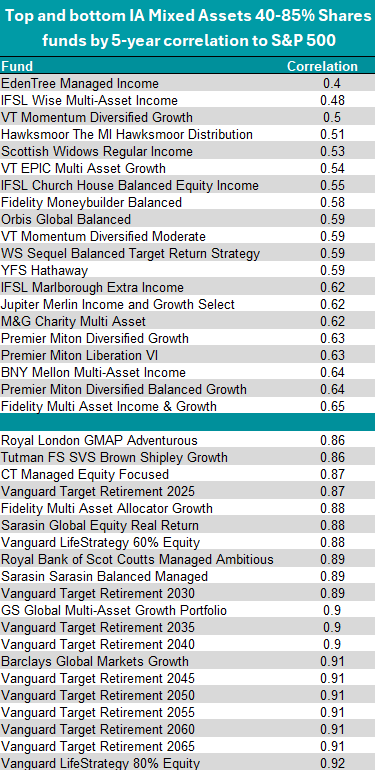
IA Mixed Asset 40-85% Shares: low-correlation funds skew income-heavy
In the 40-85% peer group, the lowest correlations came from income-oriented or multi-strategy approaches. EdenTree Managed Income registered 0.4, making it the least US-tied portfolio in this sector.
IFSL Wise Multi-Asset Income followed at 0.48, while VT Momentum Diversified Growth posted 0.50. These readings show a degree of differentiation from US large-cap equity behaviour, even within a sector expected to have higher equity exposure than the 20-60% category.
Source: FE Analytics
The highest correlations in this group were concentrated around broad-based multi-asset builders. Strategies with significant global equity exposure such as these – even when diversified – can end up tracking US market dynamics over extended periods, as the American market is such a dominant part of wider global equity indices.
At 0.92, Vanguard LifeStrategy 80% Equity had the strongest US linkage in the sector. Barclays Global Markets Growth (which was the second-best balanced multi-manager fund of the past decade) and the Vanguard Target Retirement range both followed at 0.91.
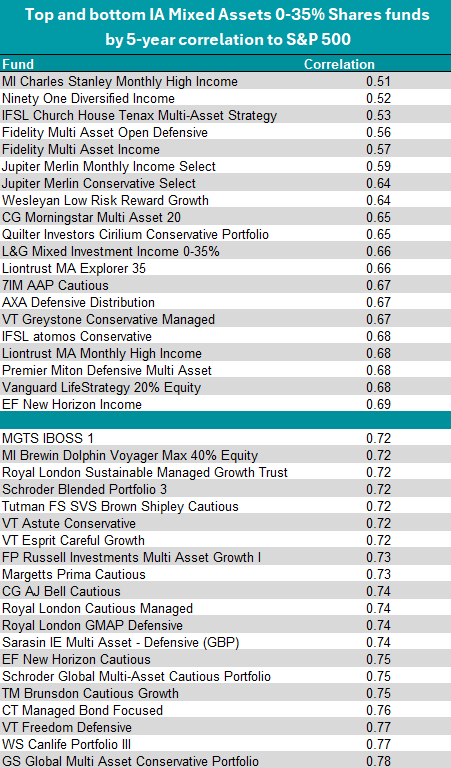
IA Mixed Asset 0-35% Shares: modest risk, but correlation still varies
The lowest correlations in the 0-35% sector were relatively higher than the lowest readings elsewhere, yet still displayed meaningful differences.
MI Charles Stanley Monthly High Income (another one to have justified its high costs) stood at 0.51, followed by Ninety One Diversified Income at 0.52 (the fund was selected this year as a top income pick for you ISA and most recently as a picks for investors fearing a global economic slowdown), and IFSL Church House Tenax Multi-Asset Strategy at 0.53.
Source: FE Analytics
The highest-correlated portfolios in this group showed a tighter relationship to the S&P 500 than some might expect from a conservative allocation band. GS Global Multi Asset Conservative Portfolio reached 0.78, with VT Freedom Defensive and WS Canlife Portfolio III both following at 0.77.
Lower nominal risk does not automatically reduce US equity linkage; depending on asset mix and risk management style, correlation can remain elevated even at the cautious end of the sector.