


Global markets delivered strong returns in 2025 despite dramatic mid-year turbulence, as investors navigated tariff shocks, a historic US credit downgrade and the fracturing of the artificial intelligence (AI) trade.
The year began with US dominance intact but ended with international markets closing the performance gap for the first time in years. Investors rotated away from expensive mega-cap technology stocks towards cheaper European, UK and emerging market equities as the ‘US exceptionalism’ narrative finally cracked.
Markets absorbed a sharp correction in April when US president Donald Trump raised tariffs to 1930s-era levels, before recovering as feared inflation spikes failed to materialise. The One Big Beautiful Bill Act, signed on 4 July, provided fiscal stimulus while the Federal Reserve delivered 75 basis points of rate cuts in the second half.
Below, Trustnet presents six charts that show investors how markets played out over the past 12 months.
Performance of asset classes in 2025
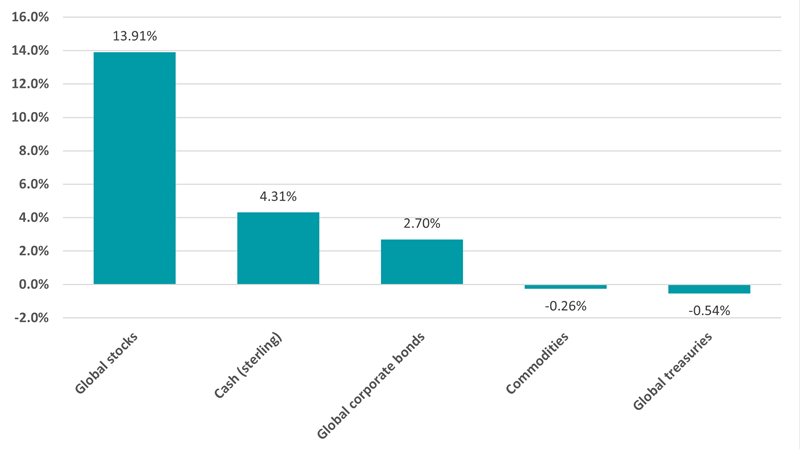
Source: FinXL. Total return in sterling between 1 Jan and 31 Dec 2025.
Global equities delivered strong returns in 2025, rising 13.9% despite volatility triggered by aggressive US tariff policy under president Trump. There was a sharp correction in April when high tariffs were unveiled on ‘Liberation Day’, but markets recovered as feared inflation spikes failed to materialise. The rally accelerated into year-end, supported by the One Big Beautiful Bill Act, which extended tax cuts and introduced new spending measures.
However, stock market performance was notably broader than in recent years, with international markets closing the gap against Wall Street. The shift reflected investors rotating away from expensive US mega-cap technology stocks towards cheaper international value names and domestically focused smaller companies that would benefit most from Federal Reserve rate cuts and fiscal stimulus.
Fixed income markets experienced volatility centred on mounting concerns over US debt sustainability. The bond market’s turbulence peaked on 16 May when Moody’s downgraded the US sovereign credit rating from Aaa to Aa1, temporarily spiking yields as investors demanded higher term premiums for holding Treasuries.
Commodities posted modest declines, falling 0.26% as stark divergence emerged between safe-haven metals and growth-sensitive energy. Precious metals enjoyed a sustained bull market driven by the debasement trade, with gold hitting multiple record highs, but oil dropped to four-year lows on slower demand.
Performance of regional equities in 2025
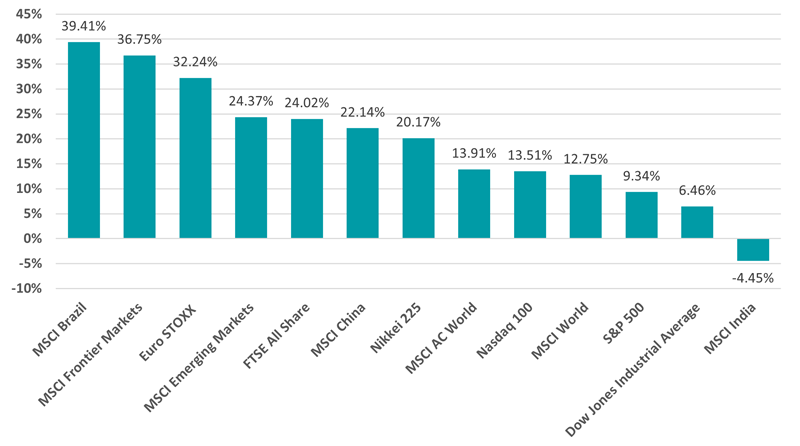
Source: FinXL. Total return in sterling between 1 Jan and 31 Dec 2025.
Emerging markets delivered the strongest equity returns in 2025, with the MSCI Brazil index surging 39.4% and frontier markets rising 36.8%. The outperformance marked a reversal of the longstanding ‘US exceptionalism’ narrative, as investors looked to diversify portfolios away from expensive and concentrated US markets to other areas of the globe.
Because of this, US equities lagged international peers for the first time in years, with the MSCI AC World Index rising 13.9% compared with 13.5% for the tech-heavy Nasdaq 100 and just 6.5% for the Dow Jones Industrial Average. That said, US small-cap stocks staged a dramatic comeback in the third and fourth quarters of 2025.
European and UK equities defied pessimistic forecasts to deliver solid returns, with the Euro STOXX rising 32.2% and FTSE All Share gaining 24%. The FTSE 100 posted its strongest performance since 2009 at 25.8%, driven by heavy weightings in mining, banking and defence sectors that outperformed in a year of geopolitical tension and commodity inflation.
Performance of industries in 2025
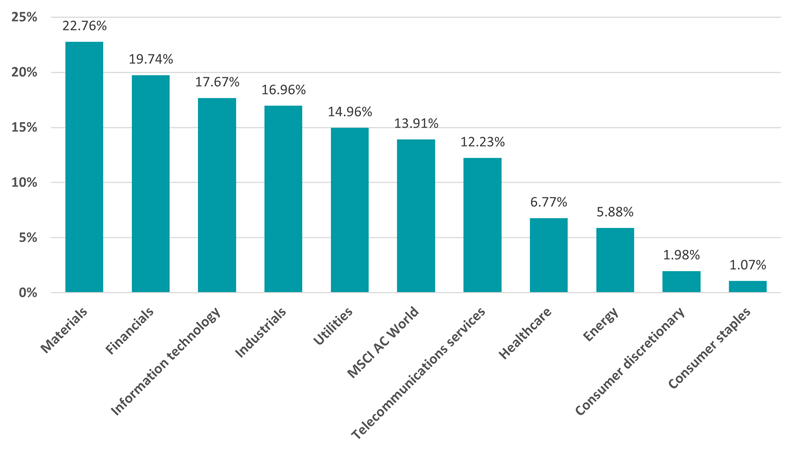
Source: FinXL. Total return in sterling between 1 Jan and 31 Dec 2025.
Tech stocks gave up their dominance in 2025; the information technology sector returned 17.7%, falling behind materials and financials. The underperformance marked a significant shift from recent years as investors moved from pricing AI’s potential to demanding proven monetisation, causing the ‘Magnificent Seven’ trade to fracture with clear winners emerging.
Materials stocks benefited from the precious metals bull market, driven by safe-haven demand following the US credit downgrade and industrial metals rallying on infrastructure spending expectations. Financials gained as banks enjoyed their most profitable year in a decade due to deregulation promises and a steepening yield curve, while industrials rose 17% on the massive infrastructure spending elements of Trump’s One Big Beautiful Bill.
Performance of investment factors in 2025
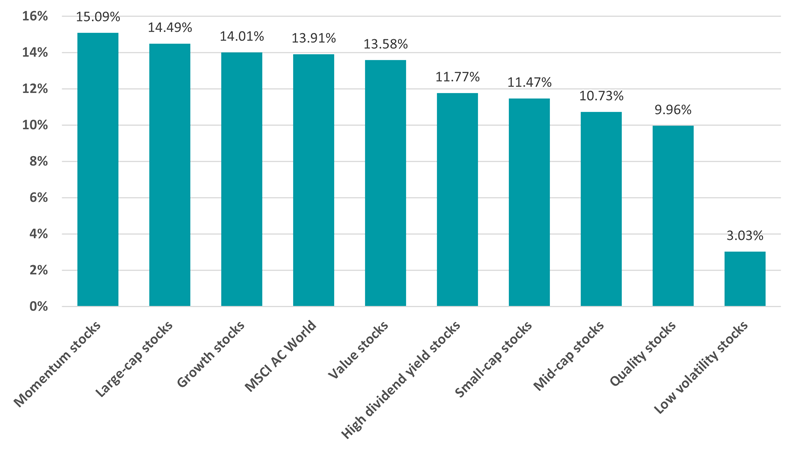
Source: FinXL. Total return in sterling between 1 Jan and 31 Dec 2025.
Momentum stocks delivered the strongest investment factor returns, closely followed by large-cap stocks and growth stocks. These factors have dominated the market for an extended period and continued to do so despite tech losing leadership.
Quality stocks underperformed while low-volatility stocks returned just 3%, suggesting defensive characteristics were punished rather than rewarded, even though markets were volatile. Investors may have been attracted more by the Federal Reserve’s expected rate cuts in the second half and the fiscal stimulus from the One Big Beautiful Bill.
Performance of commodities in 2025
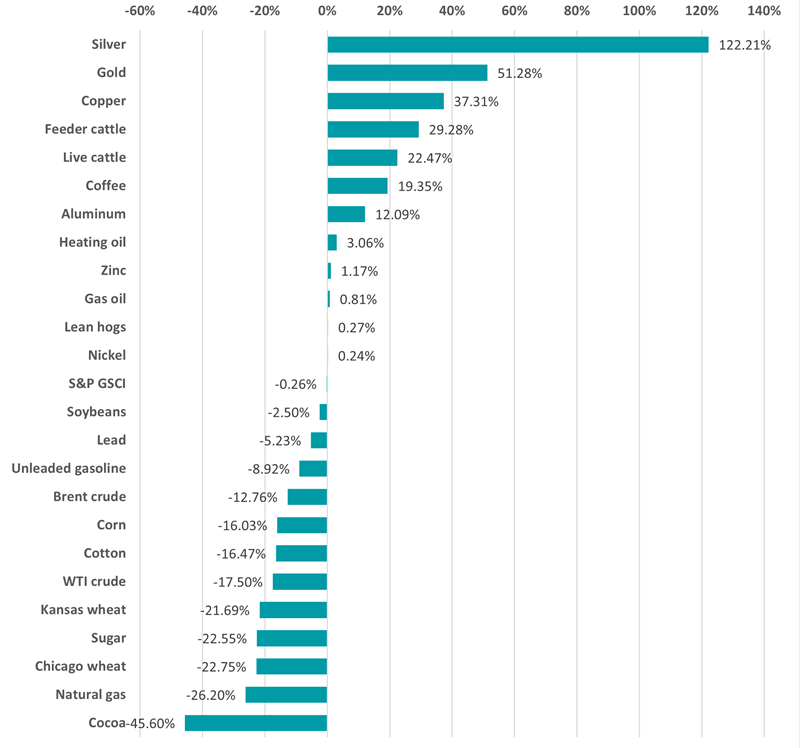
Source: FinXL. Total return in sterling between 1 Jan and 31 Dec 2025.
Silver surged to become the standout commodity performer of 2025, significantly outpacing gold’s gains. The dramatic rally reflected silver’s dual appeal as both a safe-haven asset and as an industrial metal benefiting from growing demand in solar energy applications. But gold dominated financial headlines throughout 2025, hitting multiple record highs as investors sought safe havens and embraced the debasement trade in response to aggressive US fiscal stimulus.
Commodity markets delivered sharply divergent returns over 2025, with precious metals and industrial metals rallying while energy and agricultural products suffered steep declines. Crude oil fell as persistent supply gluts and weak Chinese demand pushed prices to four-year lows, and agricultural commodities faced widespread losses, with cocoa plunging 45.6% and grains declining as favourable weather conditions boosted global harvests.
Performance of fund sectors in 2025
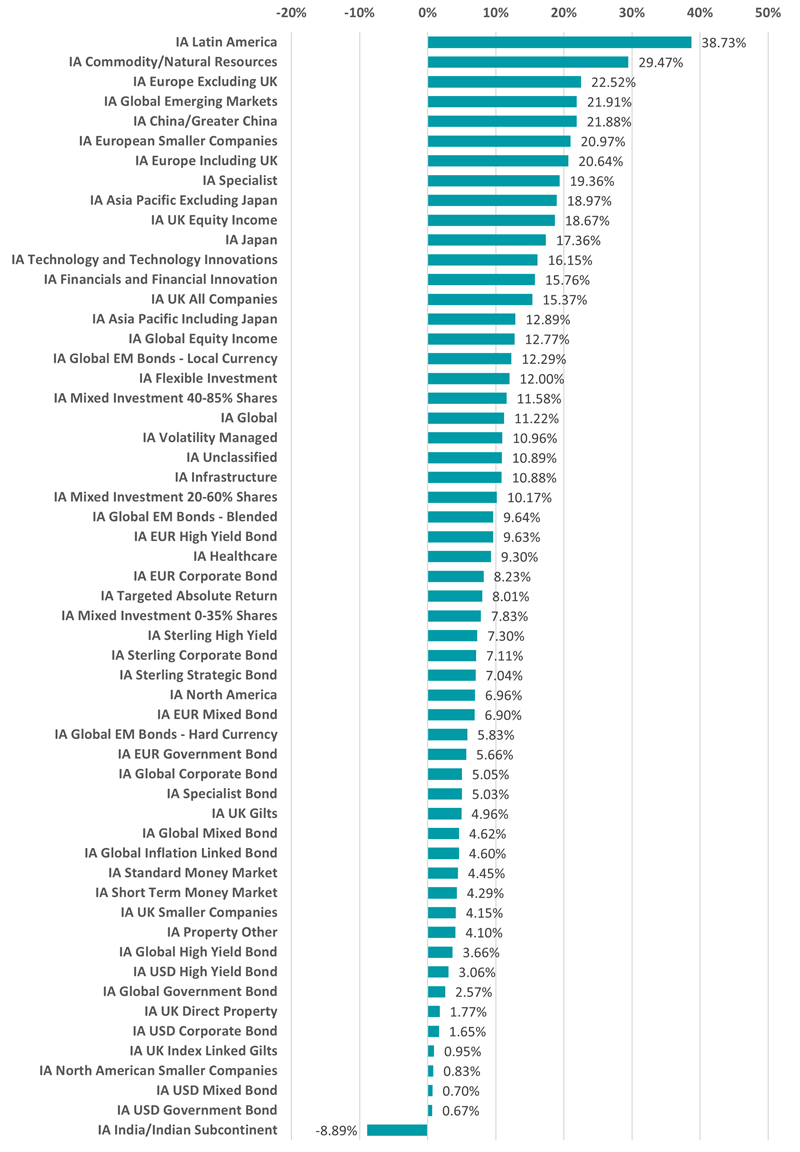
Source: FinXL. Total return in sterling between 1 Jan and 31 Dec 2025.
Funds in the IA Latin American sector delivered the strongest returns on the back of Brazil’s surge on a weaker US dollar and robust commodity prices. Commodity and natural resources funds followed closely, capitalising on the precious metals bull market and industrial metals rally as investors positioned for infrastructure spending and hedged against US debt sustainability concerns.
European and emerging market equity fund sectors also made some of last year’s highest average returns, with IA Europe excluding UK, Global Emerging Markets and China/Greater China holding third, fourth and fifth places respectively. This was a clear reversal of the US exceptionalism narrative that had prevailed in recent years, as investors rotated away from expensive US mega-cap technology stocks while seeking exposure to fiscal stimulus measures in Germany and aggressive rate cuts from the European Central Bank.
Indian equity funds posted the weakest performance of all IA sectors, with the average member losing 8.9% despite India having a robust economic outlook. The decline reflected high valuations (India had become a consensus choice for international investors in previous years), leaving little room for disappointment when quarterly results failed to meet expectations.