


Active managers in technology, commodities and emerging markets beat passive counterparts last year, but investors in the UK, Europe and financials might have performed better with a tracker, Trustnet research has found.
The debate between active and passive funds remains ongoing but has largely been in favour of those who have tracked the market, rather than trying to beat it. Indeed, active funds have posted generally “dismal results” due to underweighting large-cap stocks, according to Laith Khalaf, head of investment analysis at AJ Bell.
But how did active and passive vehicles fare in 2025? To test this, we compared the performance of the average active and tracker funds in each Investment Association (IA) sector, excluding sectors with no passives.
Active funds outperformed their passive counterparts in 22 sectors last year, according to Trustnet data, although it remained a year where most were better off tracking indices.
Areas where actives beat passives in 2025
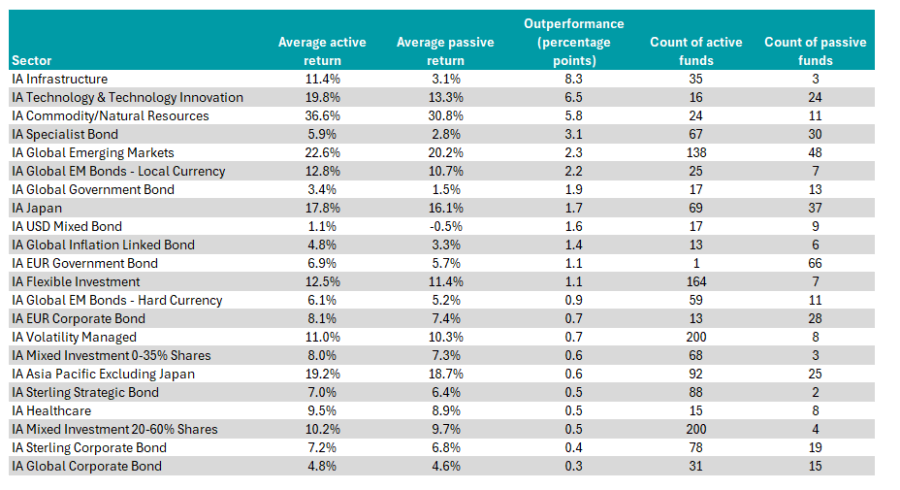
Source: FinXL. The table is sorted by outperformance.
Among the sectors where stockpickers came out on top, IA Infrastructure tops the table, with active portfolios outperforming passives by 8.3 percentage points. There are three trackers in the sector, the best of which return 5.4%. Some 26 active funds in the 36-strong sector were ahead of this.
Elsewhere, active funds beating trackers in the IA Technology and Technology Innovation sector may come as a shock, given the dominance of stocks such as the Magnificent Seven. However, the best-performing strategy in the peer was an active fund: Polar Capital Global Technology, with a 43% total return.
Additionally, the worst-performing active technology fund was up 11.4%, while four passive vehicles in the sector lost money in 2025, according to FE Analytics data, as the market started to broaden out.
Investors were also paid to go active in commodities, where passives trailed by 5.8 percentage points. The top fund in the IA Commodities and Natural Resources sector was the YFS Charteris Gold and Precious Metals fund (up 165.4%), closely followed by WS Amati Strategic Metals, which was up 162.1%.
Performance of funds vs sector in 2025
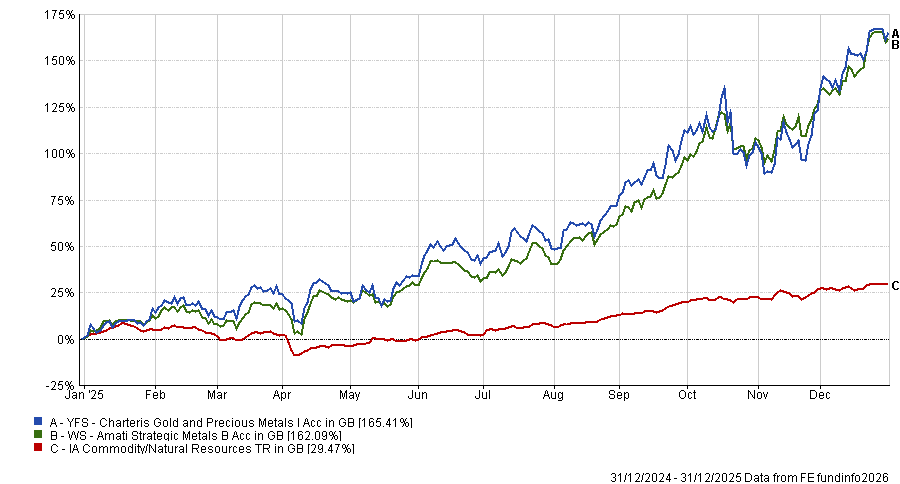
Source: FE Analytics.
However, some passive funds were not as far behind as the average may suggest. For example, the UBS Solactive Global Pure Gold Miners UCITS ETF was up 152.6%, outperforming the next best active fund by 66 percentage points.
Stockpickers also proved themselves in three regional equity sectors: IA Global Emerging Markets, IA Japan and IA Asia Pacific excluding Japan, where they outperformed the average tracker by 2.3, 1.7 and 0.6 percentage points, respectively.
The sterling bond sectors were another area where active managers pulled ahead by 0.4 percentage points (IA Sterling Corporate Bond sector) and 0.5 percentage points (IA Sterling Strategic Bond sector).
On the other side of the coin, passives were the better choice in 27 peer groups last year, as seen by the chart below.
Areas where passives beat actives in 2025
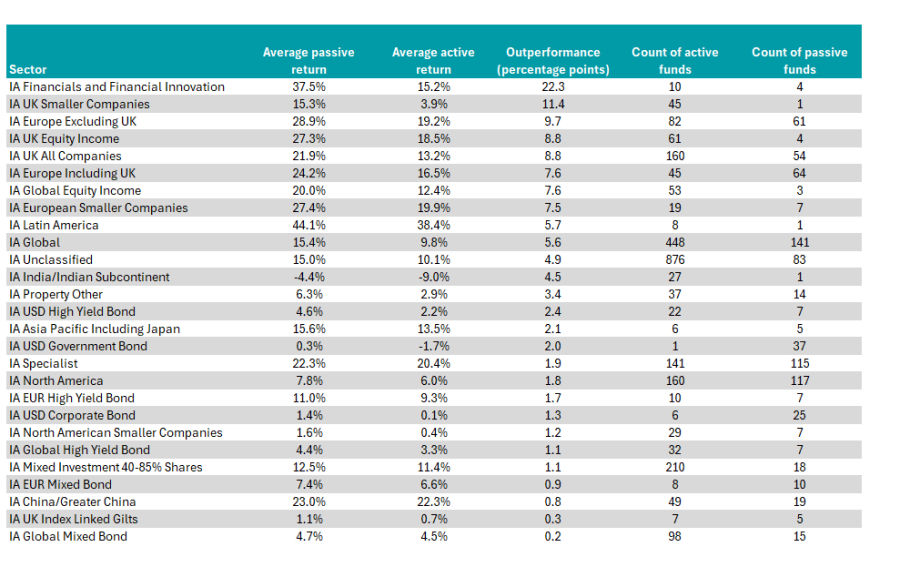
Source: FinXL. The table is sorted by outperformance.
IA Financial and Financial Innovation funds stood out, with four passives outperforming active funds by an average of 23 percentage points.
This is partially due to the exceptional performance of the Amundi Euro Stoxx Banks UCITS ETF, which rose 100.5% in 2025, the best return in the sector by 57 percentage points. Conversely, some active funds in the group lost money.
Investors may have also been better off with a passive in the IA UK All Companies sector, where the average tracker was up 21.9%, compared to the average active return of 13.2%.
The UK market was one of the best-performing global equity markets in 2025 but its rally was not evenly distributed. The blue-chip FTSE 100 surged 25.8% while small-caps and mid-caps trailed behind by comparison, as demonstrated by the chart below.
Performance of indices in 2025
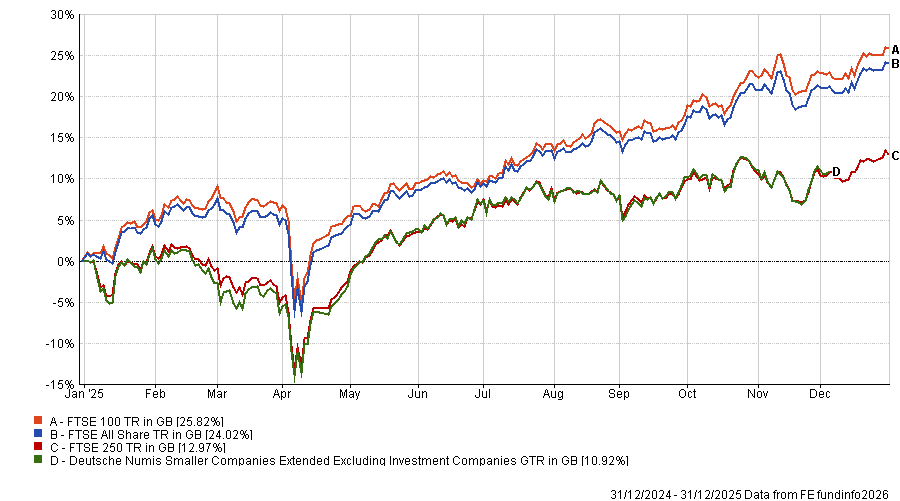
Source: FE Analytics.
This was a headwind for active funds, which tend to favour smaller companies and are usually underweight in the largest positions in the benchmark.
The picture is even worse in the IA UK Smaller Companies sector, where the sole tracker (iShares MSCI UK Small Cap UCITS ETF) beat all but two active funds.
Passive outperformance also occurred in three European sectors. Eurozone equities rallied last year, benefiting from increased infrastructure investment in Germany and strong earnings from large European defence companies.
Trackers captured this rally, with seven of the top 10 funds in the IA Europe ex UK sector last year passively managed.
Other sectors where investors would have performed better in a low-cost tracker included IA Global, IA Global Equity Income, IA North America and IA Latin America.