


There were 16 funds in the IA Global sector that have let investors sleep well in the past five years, protecting money on the downside but also using risk effectively.
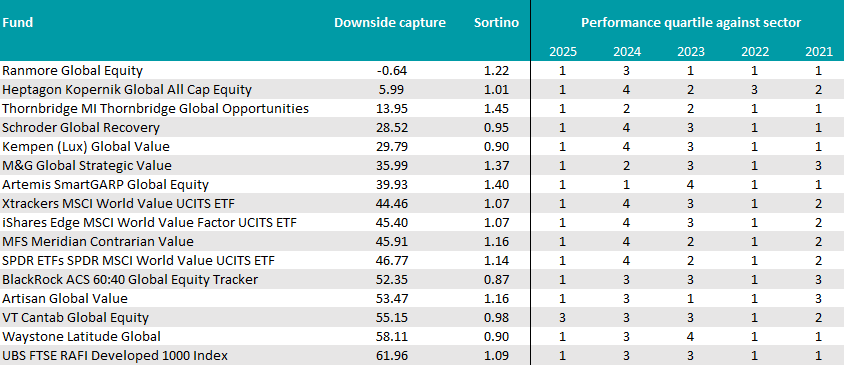
The study below ranks funds by five-year downside capture ratio, placing those in the best decile at the centre of the analysis. Downside capture shows how much a fund has moved when the market (represented by the MSCI World index, which served as benchmark) has declined: a figure below 100 means it has fallen less than the market, while a negative number means it has, on average, risen in down periods.
We then screened for performance, removing funds with a below-sector-average return. Lastly, we combined both elements, looking at funds with a top-decile Sortino ratio. This measures a fund’s risk-adjusted returns using volatility caused by downward movements (rather than overall volatility, which includes when a fund rises).
The result is a group of 16 funds that have combined market resilience with active risk management. They range from deep-value stock pickers to systematic smart-beta trackers, illustrating that low downside capture can be achieved in different ways.
Active value funds
The list is heavily populated by active value and contrarian strategies. These are the funds that, at least over five years, have tended to look very different from the market – and have been rewarded for it when conditions turned difficult.
Ranmore Global Equity sits at the defensive extreme of the universe. Its five-year downside capture of -0.64% is the lowest in the group, meaning it has historically made a small gain when the market has fallen. That has not come at the expense of risk-adjusted performance: its Sortino ratio of 1.2 also sits in the first decile.
At £1.7bn, it has been a consistent top-quartile performer for returns in four of the past five calendar years, with the only exception being 2023, when it ranked in the third quartile of its peers as growth (led by technology stocks) boomed. It is managed by Sean Peche, who recently reminded investors that “the future is unforecastable, so don't pay too much for it”.
A very different kind of contrarianism appears in Heptagon Kopernik Global All Cap Equity, which had the second-lowest downside capture (6%) paired with a Sortino of 1.01. At just under £2bn, it is one of the larger funds in this part of the list.
Schroder Global Recovery shows how recovery-style investing has translated into downside protection. The team, headed up by managers Simon Adler and Liam Nunn, was praised by FE Investments analysts for its “huge resources”.
“We like the concentration of the strategy and, as only 30% is represented in the top 10, no one stock should have a significant impact,” they said. “Despite holding some considerable sector bets, the team insists this is a result of its strict valuation criteria, deeming some sectors too expensive to invest in.”
Artemis’ popular SmartGARP approach also made the list with its £878m Global Equity fund offering good downside protection. It has been a first-quartile performer in four of the past five years and is led by FE fundinfo Alpha manager Raheel Altaf.
Another Alpha manager, Daniel O'Keefe, runs the Artisan Global Value fund, the biggest pure active value fund in the group at £4.4bn. Despite the scale, it maintained a strong defensive profile, as its downside protection and Sortino ratio testify, as per the table below.
Source: FinXL. Measured over five years to the end of 2025, relative to the MSCI World index.
Active, style-agnostic approaches
Beyond traditional value managers, three more flexible global stock pickers also made the list. Thornbridge Global Opportunities takes a more flexible, go-anywhere approach. Its downside capture is the third-best in the market, while its Sortino ratio of 1.45 is the highest in the entire group.
With assets under management of £442.9m, it has been a first-quartile performer in three of the past five years, falling to the second quartile in 2023 and 2024. Now managed by Robert Oellermann, the portfolio was run by Peche and his team as a mirror fund alongside the Ranmore Global Equity Fund until November 2022. The Thornbridge fund achieved the maximum FE fundinfo Crown rating of five.
Waystone Latitude Global, run by Alpha manager Freddie Lait, sits towards the higher end of the downside capture range at 58.1%, while maintaining a first-decile Sortino ratio of 0.90.
Its process is based around trading infrequently and investing for the long-term in a diversified portfolio of high-quality companies such as US discounter Dollar Tree (5.9%), UK supermarket chain Tesco (5.6%) and European civil engineering company Eiffage (5.5%). VT Cantab Global Equity also made the list.
Smart beta index trackers
Investing passively doesn’t necessarily mean betting on riskier, high-growth and momentum names. The trackers below take a different approach and only fell half as much as the index (the average downside capture is about 50%) while generating a good level of profit relative to the amount of downward risk taken (with a Sortino score higher than 1).
The iShares Edge MSCI World Value Factor UCITS ETF, Xtrackers MSCI World Value UCITS ETF and SPDR MSCI World Value UCITS ETF all track the performance of value-oriented companies within the MSCI World index, investing based on market capitalisation and value metrics such as price-to-earnings ratio.
The UBS FTSE RAFI Developed 1000 Index tracker, which also made the list, takes a different route to value exposure, weighting companies based on fundamental measures of size, such as total dividends, free cashflow, total sales and book value.
Finally, BlackRock ACS 60:40 Global Equity Tracker also achieved the feat. It tracks a custom benchmark, which is 60% weighted to the FTSE All Share. The remaining 40% is a combination of an index tracking European equities excluding the UK (13.3%), a US index (13.3%), a Japan benchmark (6.7%) and an Asia Pacific excluding Japan index (6.7%).