


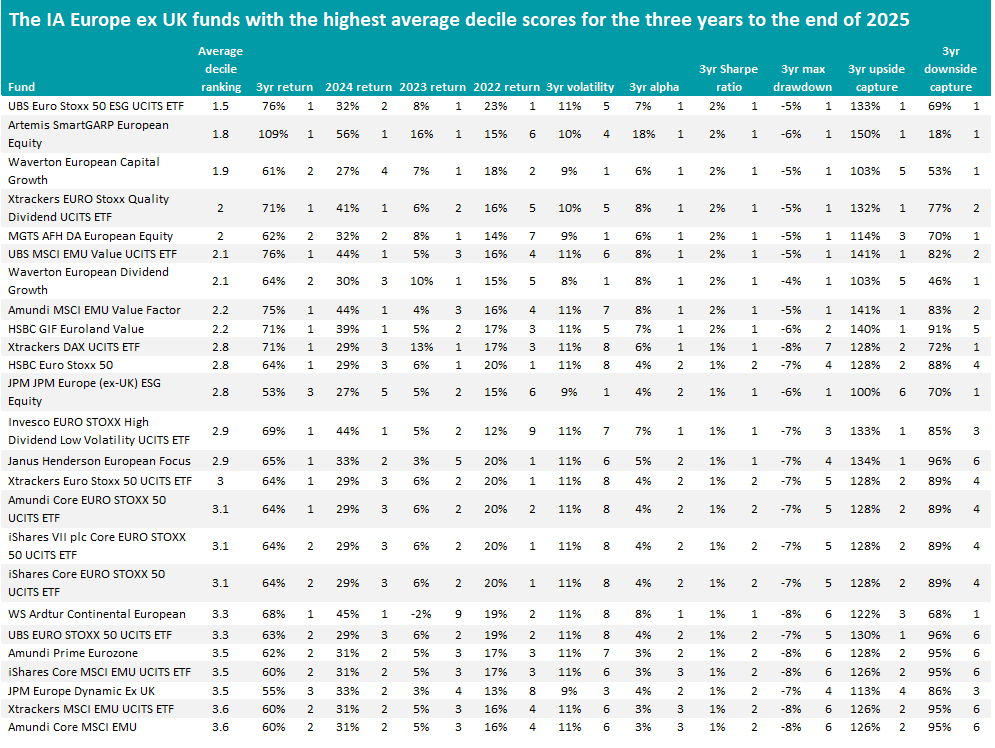
Passive investing has consistently topped the European equity sector for returns, volatility and a range of other risk measures in recent years although funds run by the likes of Artemis and Waverton show active management can still outperform, according to Trustnet research.
European equities rallied hard in 2025 but are underperforming the MSCI AC World’s 57.1% total return over the three years to the end of 2025. The average fund in the IA Europe ex UK sector made a 42.1% return over this period, below the 47.7% made by the MSCI Europe ex UK index. Of course, within the peer group, some funds are much stronger than others.
At the start of each year, Trustnet scores funds on 10 key metrics: cumulative three-year returns to the end of 2025 as well as the individual returns of 2023, 2024 and 2025 (to ensure performance isn’t down to one standout year), three-year annualised volatility, alpha generation, Sharpe ratio, maximum drawdown and upside and downside capture, relative to the sector average.
Funds are then ranked by their average decile ranking across these 10 measures, revealing which performed most reliably at the top of their peer group. In essence, a lower mean decile score indicates stronger all-round performance across the three-year period.
In previous articles, we’ve looked the IA Global and IA UK All Companies sectors. Here, we turn our attention to IA Europe excluding UK funds.
Performance of UBS Euro Stoxx 50 ESG UCITS ETF vs sector and index over 3yrs to end of 2024
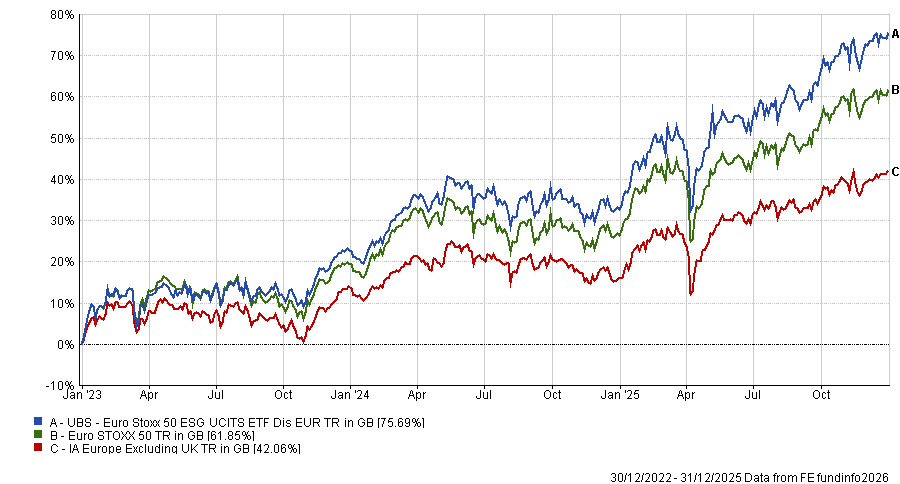
Source: FE Analytics. Total return in sterling between 1 Jan 2023 and 31 Dec 2025.
In first place with an average decile of 1.5 for the 10 metrics is UBS Euro Stoxx 50 ESG UCITS ETF, which is in the top decile for its 75.7% three-year return as well as its performance in 2023 and 2024, alpha, Sharpe ratio, maximum drawdown and both upside and downside capture. The fact that the deciles are relative to the sector average explains why a passive fund has outperformed on metrics like alpha.
Environmental, social and governance (ESG) investing has had a tough few years on the back of higher interest rates and pushback from the Trump administration in the US. However, UBS Euro Stoxx 50 ESG UCITS ETF’s largest sector exposures are to financials, technology and industrials, which have been the three strongest European equity sectors over the period under consideration.
European financials have been particularly strong; the MSCI Europe Financials index made close to 120% over the three years to the end of 2025, outperforming the Nasdaq 100’s 111.4%.
Source: FE Analytics. Total return in sterling between 1 Jan 2023 and 31 Dec 2025.
Artemis SmartGARP European Equity, in second place with a 1.8 average decile, is another fund that has benefitted from a higher weighting to financials. The £1.8bn fund has 41.8% of its portfolio in financials, including top 10 holdings Societe Generale, Banco Bilbao Vizcaya Argentaria and OTP Bank.
It has made a 108.8% total return over the three years covered by this research, which is the highest return in the sector. The fund is also in the peer group’s top decile for its 2024 and 2025 returns, alpha, Sharpe ratio, maximum drawdown, upside capture and downside capture.
Artemis SmartGARP European Equity is managed by Philip Wolstencroft, who developed Artemis’ SmartGARP process. This screen companies on eight factors, such valuation, growth, investor sentiment and macroeconomics, to find those growing faster than the market but trading on lower valuations.
In a recent note, Wolstencroft said: “After a run of such strong performance, investors may be wondering if it is too late to buy the fund. I don’t believe it is; I am still positive on the strategy. Owning stocks on a prospective P/E [price-to-earnings ratio] of less than 10x when the historic dividend yield is about 3% and where decent growth should ensue would suggest that future returns should still be good.
“I realise that the returns over the past couple of years have been extraordinary – this is down to the extraordinarily low P/E multiple the fund was on a few years ago. It has reverted towards the mean but is not yet ‘normal’. So while the extraordinary returns may be behind us, performance going forward should still be pretty good.”
Waverton European Capital Growth came in third with an average decile ranking of 1.9 and a second-decile total return of 61.3% over three years. Manager Chris Garsten attempts to find quality companies that have been overlooked by the market, focusing on earnings visibility, pricing power, cash generation, return on capital and management/shareholder alignment.
Waverton European Dividend Growth appears a little further down the list. This is managed by Charles Glasse, who is deputy manager on Waverton European Capital Growth, while Garsten is deputy manager on the dividend strategy.
However, the strongest presence among the list of the IA Europe ex UK sector’s strongest funds is passive strategies – 15 of the 25 funds on the list are index-trackers. This is despite European equities being seen as an area where active management has historically added value.
Among the passives topping the sector on multiple risk/return metrics are Xtrackers EURO Stoxx Quality Dividend UCITS ETF, HSBC Euro Stoxx 50, Xtrackers DAX UCITS ETF, Invesco EURO STOXX High Dividend Low Volatility UCITS ETF and Amundi MSCI EMU Value Factor.
Source: FE Analytics. Total return in sterling between 1 Jan 2023 and 31 Dec 2025.
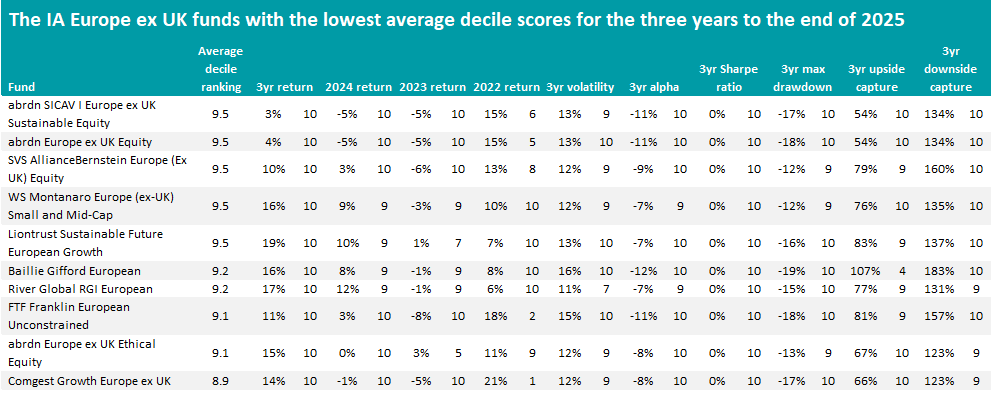
In last joint last place in this research are abrdn SICAV I Europe ex UK Sustainable Equity and abrdn Europe ex UK Equity, both with an average decile score of 9.5 and a three-year total return of just 3.5% (the lowest in the peer group).
Another three funds - SVS AllianceBernstein Europe (Ex UK) Equity, WS Montanaro Europe (ex-UK) Small and Mid-Cap and Liontrust Sustainable Future European Growth – have a 9.5 average decile score but made higher returns.
Unlike the best performing IA Europe ex UK funds in this research, only two of the 25 weakest funds across the 10 metrics examined are passive strategies: Xtrackers FTSE Developed Europe ex UK Real Estate UCITS ETF and UBS Factor MSCI EMU Quality Screened UCITS ETF, which appear outside of the 10 highlighted in the table above.