


Momentum stocks suffered their worst month since the 2008 global financial crisis in March, analysis by Trustnet shows, after the US and Israel’s attack on Iran caused investors to dump their recent winners.
Global markets have been selling off since the coordinated airstrikes on Iran started a fresh conflict in the Middle East, with Iran responding by firing missiles and drones at Israel, US bases and Gulf allies while closing the Strait of Hormuz, which carries around one-fifth of the world’s oil.
Strategists at Janus Henderson Investors said: “The Middle East conflict and effective closure of the Strait of Hormuz – a vital artery for global oil supply – drove a risk‑off shift, with March trading marked by headline-driven swings. Sometimes pointing to de-escalation, other times ratcheting up threats, news flow was relentless and often contradictory.”
Since the start of the conflict, the MSCI World index has fallen 3.9% (in sterling terms) while government bonds have shed 1.7%. Oil, on the other hand, has surged – gaining 60% to trade above $100 a barrel – while global energy stocks are up more than 10%.
Performance of indices since 28 Feb 2026
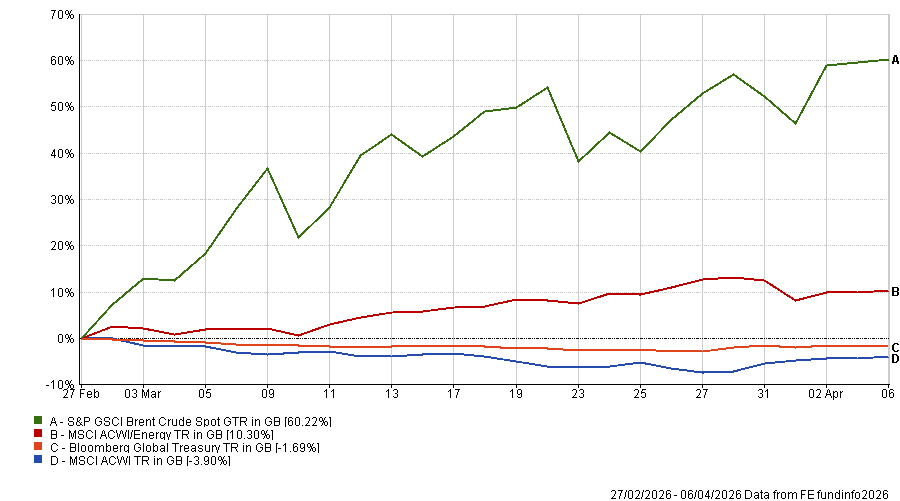
Source: FE Analytics. Total return in sterling between 28 Feb and 6 Apr 2026
However, finding assets that have risen during the war is a challenge and many have just gone through their worst month in several years. To this end, Trustnet ran the performance of more than 200 equity indices and fund sectors in every month since 2000 to discover which have been hit hardest relative to their own history.
This showed that Asian equities, especially South Korean stocks, have suffered the most. The MSCI Korea index tanked 24% in March, which is its worst performance of the 315 months we looked at in this research.
Before the war, Korean equities had been some of the best recent performers in global markets: the MSCI Korea index gained 86.1% (in sterling) during 2025 then another 25.6% in January 2026 and 24.5% in February. Investors had flocked to the country’s stocks thanks to strong demand for computer chips (Samsung Electronics and SK Hynix are Korean stocks) and president Lee Jae Myung’s investor-friendly corporate reform agenda.
Japan is another country that was previously performing strongly but has been the target of profit-taking since the start of the conflict. Additionally, Japanese stocks fell as optimism around supportive domestic policy under prime minister Sanae Takaichi faltered in light of higher energy prices and rising yields.
Our data shows the average trust in the IT Japan sector has just had its worst monthly loss since at least 2000 after falling 14.4%; the MSCI Japan index, the Topix and the average IA Japan fund, meanwhile, had their largest fall since February 2009.
More widely, emerging market equities had their worst month since the start of the pandemic in March 2020. This is another example of an area investors had been piling into before the Iran conflict, only to drop when the US and Israel started their strikes.
“Emerging market equities ended broadly lower in March as the Iran conflict exposed vulnerabilities tied to energy import dependence, currency depreciation and rising inflation pressures across the developing world,” Janus Henderson Investors’ strategists said.
| Investments that just had one of their worst months on record | |||||
| Asset | Mar-26 return | Worst month since | Worst return | ||
| MSCI Korea | -23.99% | Worst month on record | -- | ||
| IT Japan | -14.44% | Worst month on record | -- | ||
| MSCI ACWI Momentum | -10.20% | Sep 08 | -15.21% | ||
| IT Asia Pacific | -12.60% | Oct 08 | -15.55% | ||
| MSCI Sweden | -11.60% | Oct 08 | -19.09% | ||
| IA Asia Pacific Including Japan | -9.54% | Oct 08 | -11.08% | ||
| MSCI Switzerland | -10.13% | Jan 09 | -12.40% | ||
| IA Japan | -10.87% | Feb 09 | -12.72% | ||
| MSCI Japan | -10.71% | Feb 09 | -11.38% | ||
| TSE TOPIX | -10.42% | Feb 09 | -11.48% | ||
| S&P GSCI Silver Spot | -17.86% | Sep 11 | -24.72% | ||
| S&P GSCI Gold Spot | -9.49% | Nov 16 | -10.11% | ||
| MSCI ACWI/Consumer Staples | -6.98% | Nov 16 | -7.54% | ||
| MSCI South Africa | -17.02% | Mar 20 | -22.59% | ||
| MSCI United Arab Emirates | -14.64% | Mar 20 | -21.32% | ||
| MSCI India | -13.27% | Mar 20 | -22.88% | ||
| IT Europe | -12.82% | Mar 20 | -14.48% | ||
| IA India/Indian Subcontinent | -12.59% | Mar 20 | -23.51% | ||
| IT India | -12.40% | Mar 20 | -29.63% | ||
| IT Asia Pacific Smaller Companies | -12.33% | Mar 20 | -20.70% | ||
| IT Asia Pacific Equity Income | -11.94% | Mar 20 | -12.00% | ||
| UK All Companies | -11.51% | Mar 20 | -27.06% | ||
| IA UK Smaller Companies | -11.42% | Mar 20 | -22.50% | ||
| MSCI Emerging Markets | -11.36% | Mar 20 | -12.85% | ||
| IA Asia Pacific Excluding Japan | -10.86% | Mar 20 | -11.56% | ||
Source: FE Analytics. Total return in sterling between 28 Feb and 6 Apr 2026
These examples explain why momentum investing – or buying stocks that have recently risen in price on the basis that strong recent performance tends to continue in the near term – has suffered over the past month.
The MSCI AC World Momentum index lost 10.2% in March, its worst monthly showing since the 15.2% plunge in September 2008, after investors began selling rather than buying those with strong recent returns.
In a similar vein, silver had its worst month since September 2011 and gold its worst since November 2016. Both precious metals had surged since the start of 2024 and set successive record highs before selling off (actually before the conflict began).
Gold in particular has been closely watched by investors during the Iran conflict, as its safe-haven status means many expect it to rise, not fall, in times of global geopolitical crisis.
Patrick Farrell, group chief investment officer at Charles Stanley, said: “What’s driving this dramatic move isn’t a loss of faith in gold itself, but the sheer weight of positioning. Investors across the world – from institutions to private investors – were heavily ‘long’ on gold going into this period.
“With markets under pressure and liquidity at a premium, many have begun to unwind those positions. In stressed environments, investors often sell their most liquid assets first and gold is one of the deepest, most accessible markets to raise cash quickly. That dynamic has amplified the downside move.”
There are, however, exceptions to the trend of recent winners being those that fell hardest in the conflict.
Consumer staples stocks are one example. The MSCI AC World Consumer Staples index lost 7% in March, which was its worst performance since the 7.5% fall in November 2016. But it had also been the worst-performing global equity sector in 2025 with a total return of just 1.1%.
Several strategies at Templeton Global Investments have been selectively increasing their consumer staples exposure for portfolio diversification and to capture good valuations (near their lowest in 10 years), arguing that the sector benefits from resilient demand, attractive yields and tailwinds from a weaker US dollar.
However, the group’s analysts noted the ongoing risks in sector: “While our research radar has caught a number of compelling opportunities, we keep in mind the risks of poor execution, dividend cuts and unmet earnings expectations. Investor hopes for a bottoming out of consumer staples earnings have visibly increased but the sector is still in the process of multi-year restructurings and an unprecedented number of CEO changes.
“Revenue-boosting measures such as product innovations and price investments will also take time to bear fruit. Earnings inflections will not immediately and universally play out in the sector, in our view, necessitating a selective and patient approach.”
Indian stocks are another. The MSCI India index was down 13.3% in March and it – as well as the IA India/Indian Subcontinent and IT India – had its worst month since March 2020. They struggled last year because of valuation concerns and lacklustre earnings growth; more recently, on worries that higher oil prices would cause higher inflation, a fiscal deficit and squeezed corporate margins.