


Semiconductors, energy transition and the physical infrastructure of artificial intelligence have dominated ETF returns in 2026 so far, while cloud computing, fixed income and two of Asia's most popular emerging markets have been among the heaviest losers, analysis by Trustnet shows.
Trustnet took the 950-plus ETFs that are currently in the Investment Association universe and assigned them into around 130 categories based on their investment theme, sector or geography. We then ran their year-to-date returns to gain a nuanced view of what has been driving markets over 2026 so far.
The top ETF theme over 2026 so far is Korean equities, as Franklin FTSE Korea UCITS ETF, iShares MSCI Korea UCITS ETF, Xtrackers MSCI Korea UCITS ETF and HSBC MSCI Korea Capped UCITS ETF gained an average of 86.8%.
Taiwan is in second place thanks to a 50.9% average return from Xtrackers MSCI Taiwan UCITS ETF, iShares MSCI Taiwan UCITS ETF, HSBC MSCI Taiwan Capped UCITS ETF and Franklin FTSE Taiwan UCITS ETF.
Amundi MSCI Semiconductors made 49.9%, putting the semiconductor theme in third place.
Although Korea and Taiwan have some of their own drivers (Korea's corporate governance reforms being the most notable), the overriding theme among these three categories is semiconductors and their supply chain. Korea and Taiwan are the world's pre-eminent chip manufacturing nations: Korea's Samsung and SK Hynix dominate memory chip production while Taiwan's TSMC dominates advanced logic production.
The presence of these three categories taking the top of the table shows that AI-driven chip demand is the major investment theme of 2026 so far. Indeed, Deloitte has projected generative AI chips will approach $500bn in revenue in 2026, roughly half of total global semiconductor sales.
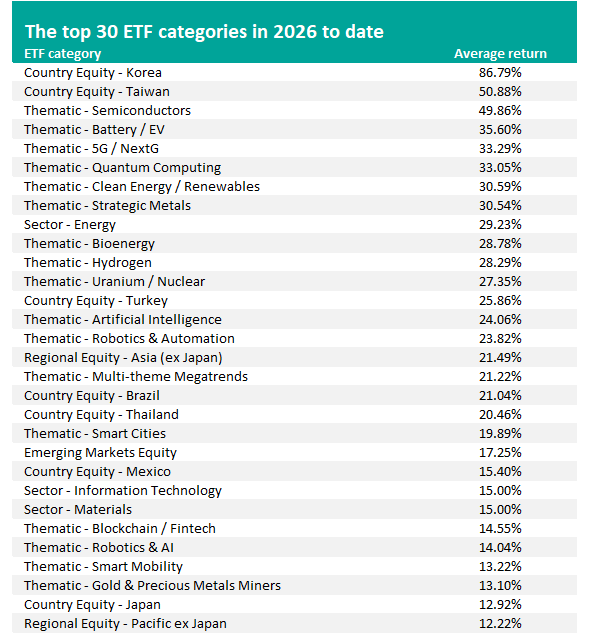
Source: Trustnet, Finxl. Average returns in sterling between 1 Jan and 12 May 2026.
Below the semiconductor cluster sits a wide range of energy-transition themes, all with strong positive returns: battery/electric vehicle technology (35.6%; L&G Battery Value-Chain UCITS ETF, WisdomTree Battery Solutions UCITS ETF), clean energy/renewables (30.6%; First Trust Nasdaq Clean Edge Green Energy UCITS ETF, Invesco Global Clean Energy UCITS ETF, Amundi MSCI New Energy), strategic metals (30.5%; WisdomTree Strategic Metals and Rare Earths Miners UCITS ETF), bioenergy (28.8%, Amundi Global BioEnergy), hydrogen (28.3%, Amundi Global Hydrogen) and uranium/nuclear (27.4%, WisdomTree Uranium And Nuclear Energy UCITS ETF).
The International Energy Agency reported that data centre electricity demand rose 17% in 2025 and projects that total data centre consumption will double by 2030, with AI-focused centres tripling their power use over the same period. Technology company capital expenditure surpassed $400bn in 2025, driven by data centre investments, and is projected to rise a further 75% in 2026, with power procurement a primary constraint on expansion.
Traditional energy sector ETFs also performed strongly, with an average return of 29.2%. Some of the best-performing ETFs in this category are State Street SPDR MSCI Europe Energy UCITS ETF, Amundi STOXX Europe 600 Energy Screened, Amundi S&P World Energy Screened UCITS ETF and Xtrackers MSCI World Energy UCITS ETF.
The boost here was provided by a separate event: the effective closure of the Strait of Hormuz by Iran following military strikes by the US and Israel in February and March pushed oil and gas prices higher.
Source: Trustnet, Finxl. Average returns in sterling between 1 Jan and 12 May 2026.
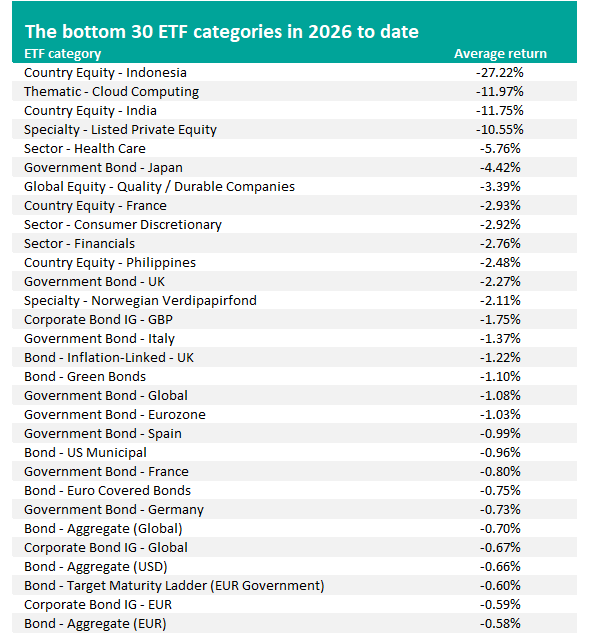
However, the data also shows a significant divergence within the AI theme. While semiconductor ETFs have averaged 49.9% and AI ETFs 24.1%, those focused on cloud computing posted an average loss of 12% (making it the second-worst ETF category).
In early 2026, investors worried that generative AI tools were likely to compress revenues in traditional subscription software businesses. The year-to-date ETF returns suggest markets are rewarding the physical infrastructure layer of AI (chips, power generation and the metals required to build both) but the software layer, which was the primary beneficiary of AI enthusiasm in earlier years, is being repriced.
Fixed income ETFs have also struggled, with no bond category making a meaningful return over 2026 so far. This is likely down to a range of factors, such as sticky inflation, high government borrowing and limited room for central banks to cut rates, keeping yields elevated.
Gilts are under particular pressure, with the 30-year gilt yield reaching its highest level since 1998 after the energy shock raised inflation expectations and markets worried about the possibility of a Labour leadership change that could weaken the government's commitment to fiscal consolidation.
The worst performing ETF category so far has been Indonesian equities, following the 27.2% loss by HSBC MSCI Indonesia UCITS ETF.
In late January, MSCI warned it might downgrade Indonesia from emerging market to frontier market status, citing opaque share ownership structures, insufficient free-float requirements and evidence of price manipulation in local markets.
The Jakarta Composite Index fell approximately 8% on 28 January and a further 10% the following day, wiping around $120bn from market capitalisation in two sessions; both the chief of the Financial Services Authority and the chief executive of the Indonesian Stock Exchange subsequently resigned. Moody's then lowered its credit rating outlook for Indonesia to negative and the Strait of Hormuz closure compounded the pressure as Indonesia has been a net oil importer since 2003.