






When US president Donald Trump unveiled a long list of tariffs on friends and foes on 2 April 2025 – or ‘Liberation Day’ – it triggered more than a year of turbulence.
With conflict in the Middle East, persistent inflation, softening labour markets and the AI boom, market leadership has been rewritten, polarising returns within some sectors far more than others and creating wide gaps between the best and worst-performing funds.
This means that choosing the right fund has been more important in some sectors than others.
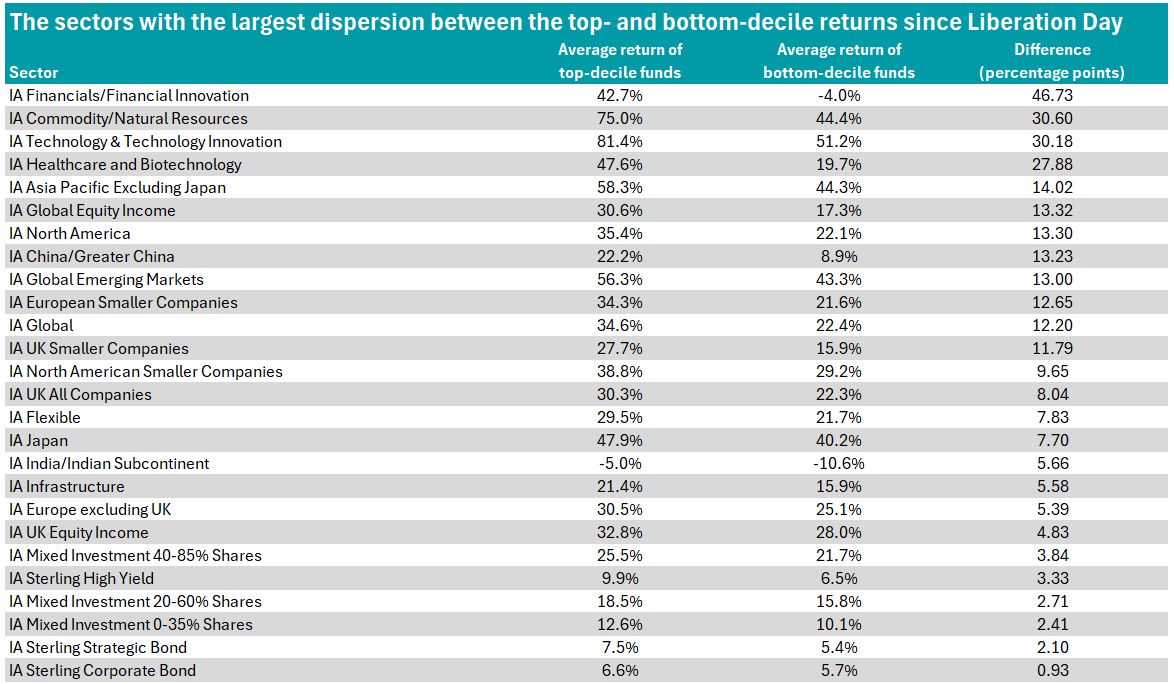
To see where fund selection would have made the most difference, Trustnet looked at the percentage point difference between the average returns of the top and bottom 10% of every Investment Association (IA) sector between 2 April 2025 to the end of August 2026.
Source: FE Analytics
The IA Financials/Financial Innovation sector recorded the largest gap between funds in the top and bottom deciles, at 46.73 percentage points. The top decile averaged a 42.7% return, while the bottom decile posted an average 4% loss.
Over this period, funds backing traditional bank names won out over niche financial innovation strategies, with the strongest return in the sector logged by Amundi Euro Stoxx Banks, which gained 84.6%. The fund benefited from the European banks rally as investors sought safety in more defensive names and banks benefited from sustained interest rates.
In contrast, specialist strategies with more limited or no bank exposure struggled. Robeco FinTech and Wellington FinTech Fund lost 2.6% and 8.9% respectively, reflecting the weaker performance of fintech names over the period.
The top and bottom 10% of the IA Commodity/Natural Resources sector posted stronger average returns than funds in the IA Financials/Financial Innovation sector, gaining 75% and 44.4% respectively but the gap between the two was narrower, at 30.60 percentage points.
The sector benefited from the meteoric rise in gold prices as investors flocked to the established ‘safe haven’ asset, diversifying away from more volatile bonds and equities.
Although gold has not been on a smooth upward trajectory, had an investor held their nerve through the highs and lows, the result would likely have been net positive, with the gold spot price increasing from £2,430.81 per ounce on 2 April 2025 to £3,223.90 on 31 August 2026.
The top 10% in the sector included WS Amati Strategic Metals, YFS Charteris Gold and Precious Metals & Silver Miners UCITS ETF and UBS Solactive US Listed Gold & Silver Miners UCITS ETF.
At the top of the sector, WS Amati Strategic Metals currently invests almost half of its assets (47%) invested in gold and 19.6% in silver.
Meanwhile, investors picking funds with more concentrated exposure in commodities and natural resources such as timber or water would have found themselves in the bottom decile, with Pictet Timber, for example, losing 8.1%.
Perhaps unsurprisingly, IA Technology & Technology Innovation rounds out the top three sectors with the biggest dispersion between the top and bottom decile funds.
Although the highs in the sector have been dizzying, buoyed by the AI build-out, this has created huge dispersion between AI-focused winners and software-focused laggards.
As such, the sector logged a 30.18 percentage point difference between the average returns of the top and bottom deciles. At the top end, the average return was 81.4% – the highest of all the sectors in the table – while the bottom decile averaged a 51.2% return.
Amundi MSCI Semiconductors posted the strongest return in the sector at 153.7%, benefiting from its pureplay exposure to companies integral to AI chip production, while Polar Capital Global Technology followed closely with a 151.3% gain.
At the other end of the performance spectrum, SSGA State Street SPDR MSCI Europe Communication Services UCITS ETF returned 2.9%, placing it firmly in the bottom decile.
One country greatly impacted by its lack of exposure to AI names – compounded by 50% tariffs which were reduced to 18% earlier this year – is India.
Investors picking funds in the IA India/Indian Subcontinent were likely to make a loss, whether they picked a fund in the top decile for returns or the bottom decile. The top 10% averaged a 5% loss while the bottom averaged a 10.6% loss, resulting in a 5.66 percentage point difference.
Among other region-specific sectors, IA Asia Pacific Excluding Japan showed one of the largest gaps, with a 14.02 percentage point difference between the top and bottom performers, meaning fund selection played a more significant role here.
Closer to home and dispersion in the IA UK Equity Income sector was far more muted. The difference between the top and bottom deciles was just 4.83 percentage points, suggesting that investors would have seen broadly similar outcomes regardless of which fund they picked.
Meanwhile, the IA UK All Companies sector recorded an 8.04 percentage point difference between the best and worst performers in the sector over the assessed period, with the top decile averaging 30.3% and the bottom 22.3%.
The IA UK Smaller Companies sector logged the biggest dispersion between the best and worst funds, with a gap of 11.79 percentage points.
Looking at all three UK sectors together and the best return was logged by SVS Zeus Dynamic Opportunities, which sits in the IA UK All Companies sector. The fund, which only launched in 2023, gained 56% between Liberation Day and the end of August 2026, with its top holdings dominated by stalwart defensive UK large-caps, including BP, Tesco and Barclays.
The worst-performing fund across all three UK sectors since Liberation Day is WS Lindsell Train UK Equity, which lost 3.2%, continuing its weak run, having been in the bottom decile of the sector since 2024.