






UK equity funds' combined share of the industry's assets has nearly halved over the past decade, according to Trustnet's analysis of Investment Association data, as investors shifted allocations towards global and North American equities over the domestic market.
The three main UK equity sectors – IA UK All Companies, IA UK Equity Income and IA UK Smaller Companies – accounted for 24.6% of total assets in the Investment Association universe in December 2016. By July 2026, their combined share had fallen to 13.1%, a decline of 11.5 percentage points.
In monetary terms, the three UK peer groups were home to funds running a total of £233.1bn in December 2016 but this fell to £196.9bn at the end of July 2026. This came even though the wider industry expanded by roughly 60% over the same period (going from £947.5bn at the end of 2016 to just over £1.5trn today).
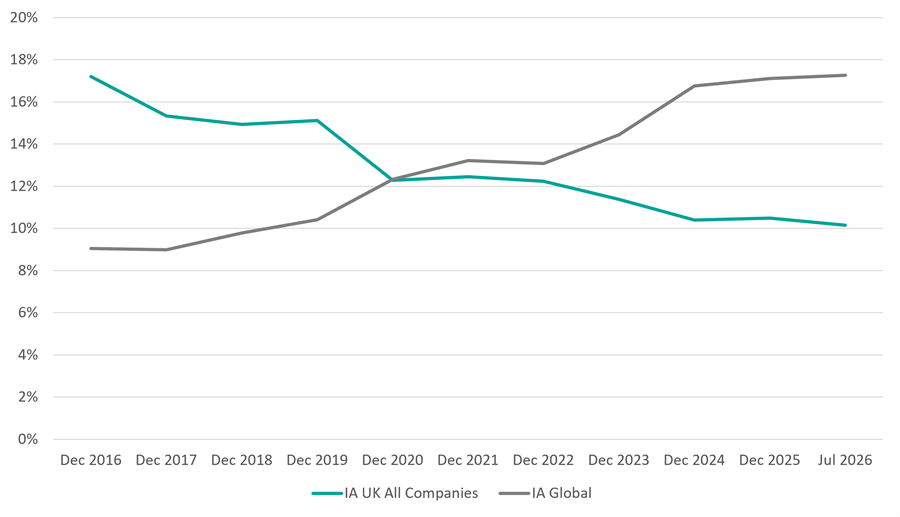
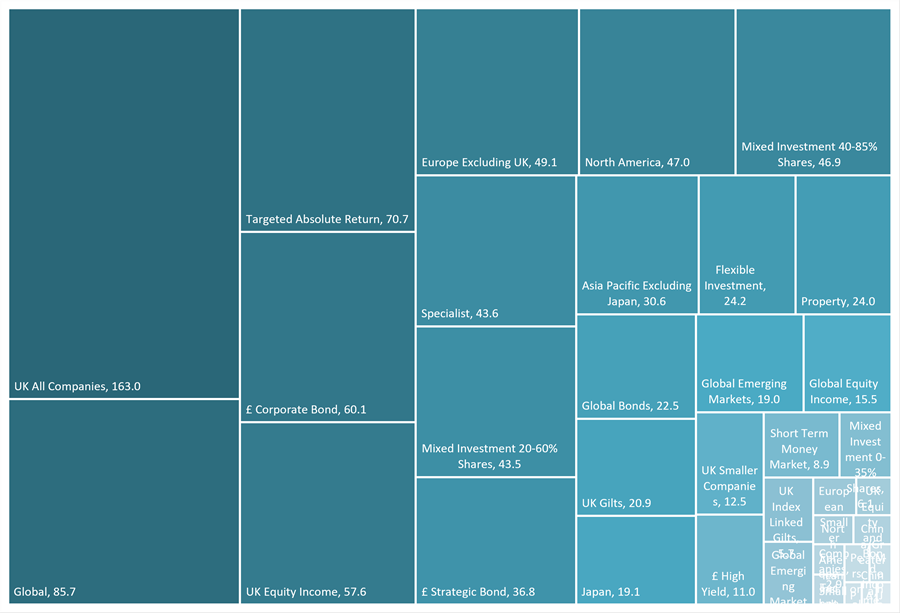
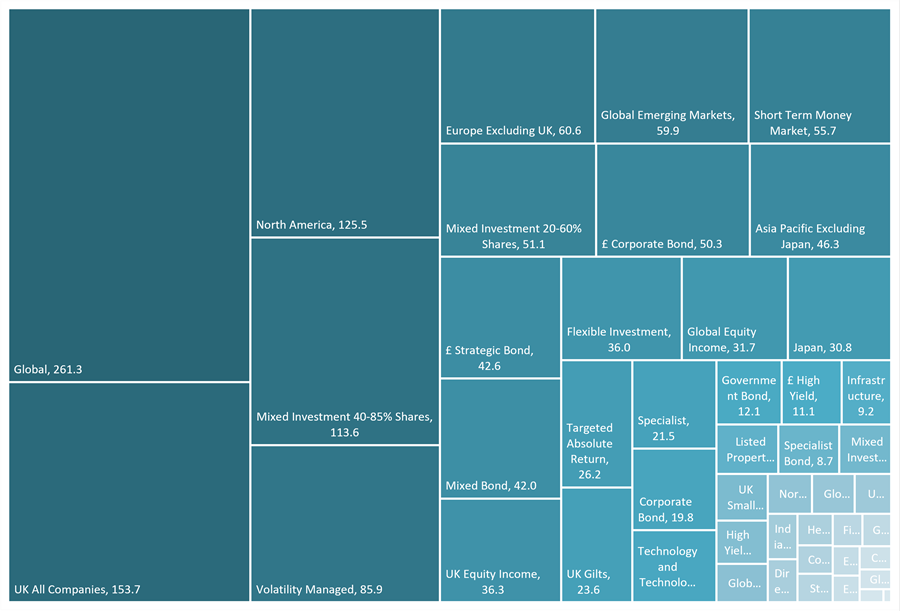
IA UK All Companies, the largest of the three UK equity sectors, saw its share fall from 17.2% to 10.2%. Its assets declined in real terms, from £163bn to £153.7bn.
The IA UK Equity Income sector's share fell from 6.1% to 2.4%, and like UK All Companies, its assets shrank in absolute terms too, from £57.6bn to £36.3bn. IA UK Smaller Companies went from a 1.3% share to just 0.5% (£12.5bn to £6.9bn).
The decline coincides with a prolonged period of political and economic uncertainty surrounding UK-listed companies, beginning with the 2016 referendum on membership of the European Union.
Industry commentators have widely pointed to this uncertainty, along with subsequent elections, multiple prime ministers and policy changes, as a factor discouraging global and domestic investors alike from holding UK equities at their previous weightings.
Change in IA UK All Companies and IA Global share of assets since Dec 2016
Source: Trustnet, Investment Association
Global funds moved in the opposite direction. The IA Global sector's share rose from 9% to 17.3%, with assets climbing from £85.7bn to £261.3bn, and overtaking IA UK All Companies in 2021 to become the industry's largest sector.
The share of IA North America funds increased from 5% to 8.3%, with assets rising from £47bn to £125.5bn. It is now the third largest sector in the Investment Association, having been in seventh place 10 years ago.
The increase in global and north American fund assets occurred alongside a sustained period of strong returns from US technology stocks, including the FAANG (Meta, formerly Facebook, Amazon, Apple, Netflix and Alphabet, Google's parent company) bull market and, more recently, the massive surge in companies developing AI technology.
Global equity indices such as the MSCI World now carry a substantial weighting to the US and to technology stocks specifically, which means fund performance in the sector has been closely tied to this trend.
Combined, IA Global and IA North America funds now hold 25.5% of industry assets, up from 14% in 2016.
Total equity allocation across the Investment Association universe has stayed between 55% and 60% the period, suggesting investors have rotated within equities towards global and US mandates rather than reducing their overall exposure to shares.
IA sectors by AUM in Dec 2016 (£bn)
Source: Trustnet, Investment Association
Other sectors have shifted markedly in share since 2016, several of them tied to the same technology-driven market conditions or to separate structural changes in the industry.
IA Technology and Technology Innovation funds increased sixfold in share, from 0.2% to 1.2%, albeit from a small base. The rise mirrors the same technology-led market conditions that have benefited IA Global and IA North America funds more broadly.
The IA Targeted Absolute Return sector saw one of the sharpest declines in the data, however. Absolute return funds' share fell from 7.5% to 1.7%, with assets down from £70.7bn to £26.2bn, a dramatic fall in AUM given that the wider industry grew over the same period.
The decline follows a period in which several funds in the sector failed to deliver the smooth, all-weather returns they were marketed on during periods of market stress, denting investor confidence across the sector as a whole.
Multi-asset and risk-targeted funds, covering the three Mixed Investment peer groups, Flexible Investment and Volatility Managed, rose from a combined 12.7% share in 2016 to 19.4% in July 2026.
The growth-oriented IA Mixed Investment 40-85% Shares sector gained share, from 4.9% to 7.5%, while the more cautious 20-60% and 0-35% peer groups were broadly flat or fell. IA Volatility Managed funds, a risk-targeted category introduced in 2017, grew from 2.2% to 5.7% of industry assets.
The shift also coincides with wider changes in UK financial advice since the 2012 Retail Distribution Review, which encouraged advisers to move away from picking individual funds and towards outsourced, risk-graded investment solutions.
IA sectors by AUM in Jul 2026 (£bn)
Source: Trustnet, Investment Association
IA Short Term Money Market funds' share rose from 0.9% in 2016 to 3.7% by July 2026, with assets climbing from £8.9bn to £55.7bn. The increase has accelerated recently: the sector's share climbed from 2.8% to 3.7% in the seven months between December 2025 and July 2026.
The acceleration follows a period of higher UK interest rates, with the Bank of England holding its base rate at elevated levels through 2022 and 2023, making cash and money market funds more competitive with other asset classes than at any point in the previous decade.