


Almost 30 IA Global active funds have a significant overlap with the top 10 holdings of a MSCI World index tracker, according to research by Trustnet.
The biggest 10 stocks make up a quarter of the index, so how much a fund holds in them can have a large bearing on whether it beats or lags its benchmark. Holding more than the index weight amounts to a bet that the AI-led run in the largest technology companies will continue.
In this research, Trustnet used FE fundinfo holdings data to compare the top 10 positions of 342 active IA Global funds against the 10 largest constituents of the MSCI AC World at 30 September 2026. Passive funds, funds of funds and portfolios with holdings data older than July 2026 were excluded and the findings cover top 10 holdings only, so they may understate each fund’s full exposure.
Chip maker Nvidia is the largest constituent of the MSCI AC World, with a 5.11% weighting, followed by Apple (4.76%), Microsoft (3.52%), Amazon (2.35%), Alphabet A shares (1.97%) and Taiwan Semiconductor Manufacturing (1.87%).
Alphabet C shares, Meta and Broadcom each have a 1.55% weighting and Micron Technology is the smallest of the group at 1.17%. With its two share classes combined, Alphabet has a 3.52% weighting, level with Microsoft.
In total, the 10 stocks account for 25.4% of the index.
Being the biggest and best-known companies in the market, these stocks are well represented in the top 10 holdings of IA Global funds. FE fundinfo data shows that, of the 342 active equity funds covered in this research, the combined weight to these stocks averages 14.5%, so the average active fund holds roughly 10 percentage points less than the benchmark in its biggest positions.
In addition, the typical portfolio holds three or four of the index leaders in their top 10 and 122 funds have five or more of these companies among their largest holdings.
Source: FinXL, MSCI
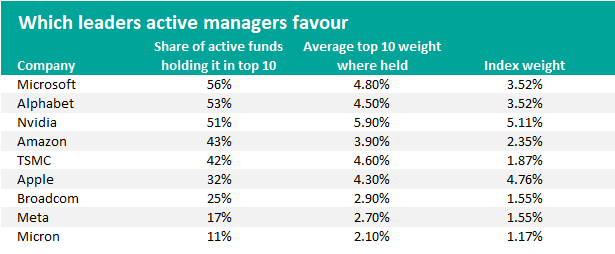
As the table above shows, more than half of active IA Global funds hold Microsoft, Alphabet and Nvidia either on their own or in combination in their top 10. Despite being the index’s second-largest holding, Apple is in the biggest positions of less than one-third of the sector, while Meta and Micron are the least held.
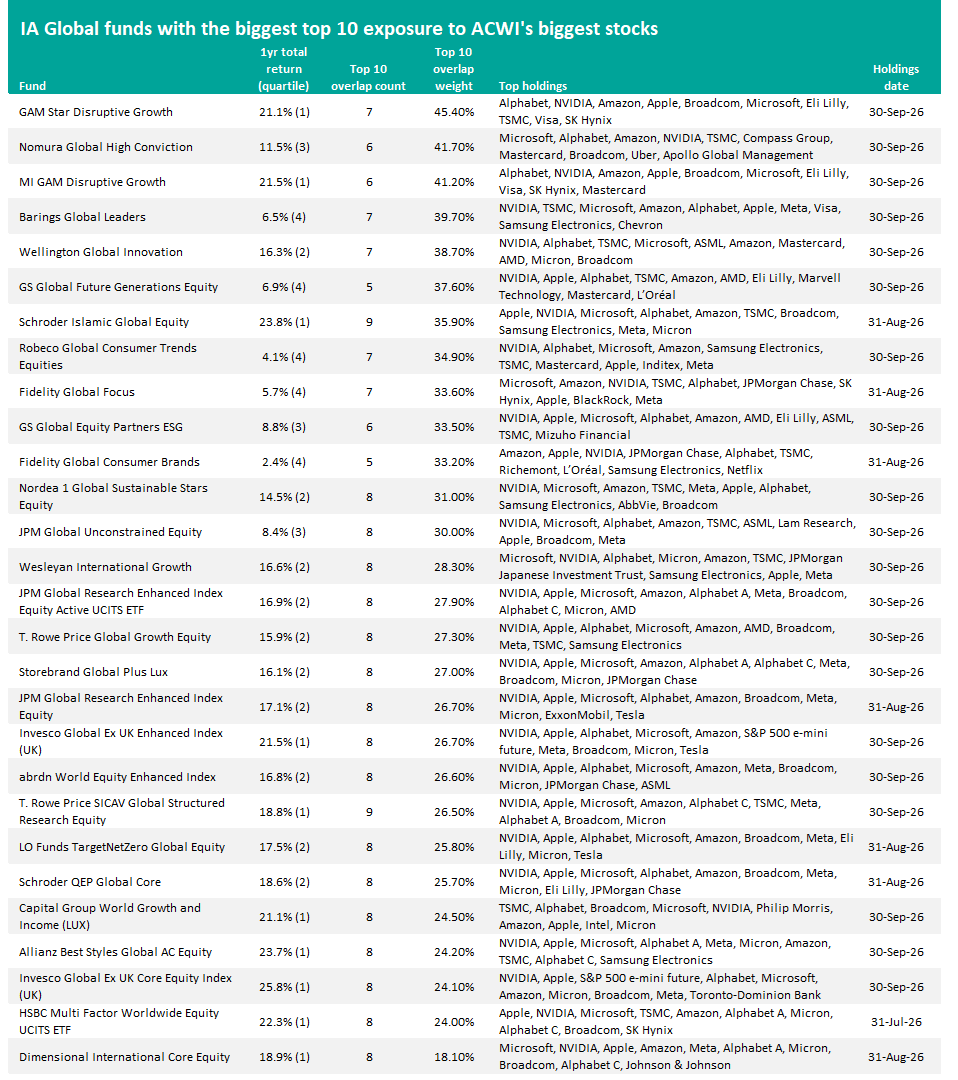
Given the popularity of these stocks, some global equity funds have a higher exposure to them than the index. Our research found 28 active funds have either eight or more of the nine leaders in the top 10 or a combined leader weight of 33% or more.
The 28 funds fall into two broad camps: 10 funds make concentrated bets, with fewer leaders held at large weights, while 18 hold eight or nine leaders at weights close to the index’s 25.4%.
Source: FinXL
GAM Star Disruptive Growth, at the top of the table thanks to a 45.4% weighting in its top 10 to the index’s biggest names, is an example of one of the ‘concentrated bets’ themes: disruption and innovation.
Funds such as this invest in companies driving technological change. As many of the index leaders are the largest beneficiaries of AI spending, whether through chips (Nvidia, TSMC, Broadcom, Micron) or cloud platforms (Microsoft, Alphabet, Amazon), a manager hunting for disruptive growth ends up holding them in size.
The other funds fitting this theme are MI GAM Disruptive Growth (using the same strategy as the above fund), Wellington Global Innovation and GS Global Future Generations Equity.
Another four funds can be described as ‘concentrated leaders and focus’ funds such as Nomura Global High Conviction, Barings Global Leaders, Fidelity Global Focus and GS Global Equity Partners ESG.
These tend to build portfolios of large, high-quality companies and often favour the market’s leading stocks as they are among the biggest and most profitable businesses in the world. Each of these funds holds a third or more of its assets in the leaders.
As their names suggest, Robeco Global Consumer Trends Equities and Fidelity Global Consumer Brands invest in consumer stocks. ‘Consumer stocks’ are defined broadly enough to include the platforms people use every day, such as Amazon, Apple and Alphabet.
Another four funds – JPM Global Unconstrained Equity, Wesleyan International Growth, T. Rowe Price Global Growth Equity and Capital Group World Growth and Income – could be described as ‘diversified growth and core’ strategies.
These tend to run broader portfolios and pay attention to the benchmark, so failing to own a stock that accounts for a sizeable share of the index would be a big bet for their manager to make.
Screened funds are another theme in the table above. These funds remove whole sectors because of their exclusion screens and increase the weight of the other companies that remain.
Shariah screens exclude conventional banks and companies with high debt (Schroder Islamic Global Equity), while net-zero and sustainability screens cut fossil fuels and heavy emitters (Nordea 1 Global Sustainable Stars Equity, LO Funds TargetNetZero Global Equity). Large technology companies tend to pass both as they carry little debt and have low direct emissions, so can be owned by funds such as this.
Finally, 10 funds on the list use an enhanced index or quantitative investment approach, which means they add small active bets through stock tilts or factor models. Because of this, they can hold almost every leader at roughly the index’s weight and, while not purely index trackers, can sit close to passive investing.
Funds in this bucket include JPM Global Research Enhanced Index Equity, abrdn World Equity Enhanced Index, Allianz Best Styles Global AC Equity, HSBC Multi Factor Worldwide Equity UCITS ETF and Dimensional International Core Equity.