


Equity markets have become even more concentrated over the past two years than they were in 2023, Trustnet analysis has revealed, but despite fears that the ‘Magnificent Seven’ US stocks have become too important to the American (and global) market, they do not represent the biggest concentration risk among major markets.
Two years ago, we examined the most concentrated equity markets and found the FTSE 100 took the throne. At the time, the 10 largest stocks on the index accounted for nearly 46% of the overall market capitalisation in the UK.
Over the past two years, markets have become even narrower across the board, with the top 10 stocks representing a greater percentage of most global indices, except in the Euro STOXX and FTSE 100, which has since lost its top spot.
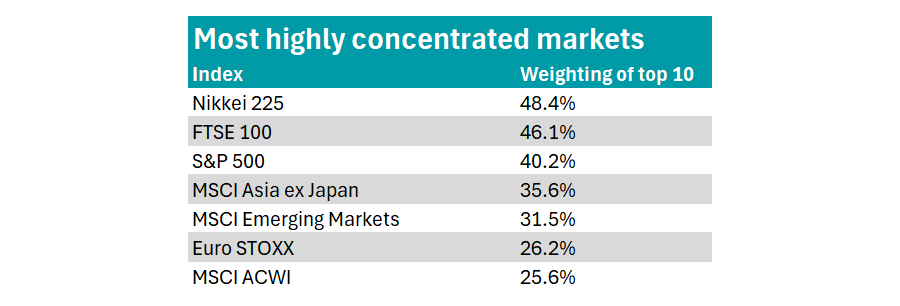
Source: London Stock Exchange, Nikkei, S&P Dow Jones, MSCI, STOXX
Now, Japan’s Nikkei 225 is the most concentrated market, with its top 10 accounting for 48% of its total value.
Tech companies lead the index, with semiconductor testing company Advantest and multinational conglomerate SoftBank ranking as the two largest stocks within the index. With each having a double-digit allocation, more than 20% of the Nikkei is now invested in just two names.
Fast retailing and Tokyo Electron follow in third and fourth place, after which point weighting drops to just 2.6%.
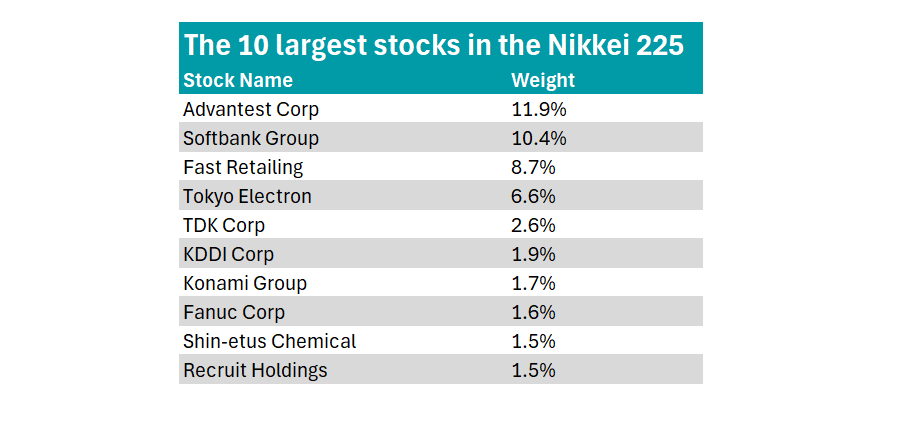
Source: Nikkei
Meanwhile, the concentration in the FTSE 100 has only increased by 0.1 percentage point over the past two years, but the market's composition has shifted with Rolls-Royce and Barclays joining the top 10 since 2023.
While the UK blue-chip index has also posted a strong return this year (up 25.1% year to date), outperforming the MSCI ACWI (up 16.2%), experts recently said that a handful of exceptional performers have led this charge.
Meanwhile, the S&P 500 and MSCI ACWI have both experienced rises in concentration risk due to investor enthusiasm for the ‘Magnificent Seven’. These high-growth tech stocks have performed very well in recent years and have continued to attract investor capital.
As a result, they now dominate the top 10 of global and US indices, causing concentration risk to creep higher. Compared to 2023, the weighting towards the top 10 is 5.2 percentage points higher in the S&P 500 and 7.3 percentage points higher in the MSCI ACWI.
Finally, in both the MSCI Asia ex Japan and MSCI Emerging Markets, more than 30% of the total value is in the top 10 companies, with the latter’s concentration up by 8.7 percentage points compared to 2023.
Simon Evan-Cook, fund of funds manager at VT Downing Fox, said: “The trend towards ‘big’ has been in place for a long time, and despite the odd reversal, has only picked up speed this year.”
The rising dominance of a handful of global stocks in each market is partially due to the enthusiasm for passive investing, he said.
Index trackers have become a popular way to access equity markets in recent years as active funds have struggled to outperform. Indeed, just 30% of equity funds have outperformed a passive alternative over the past decade, according to data from AJ Bell.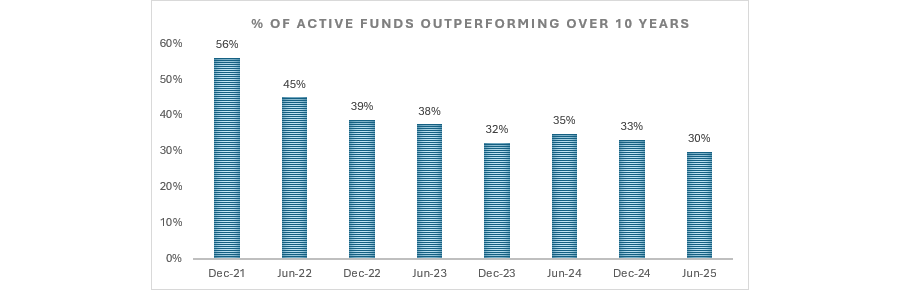
Source: AJ Bell Manager versus Machine reports 2021 through to 2025
Evan-Cook said the rise of trackers has “naturally driven capital to those companies at the top of the index, which will appear in more indices and ETFs [exchange-traded funds]”.
Additionally, markets are also reflecting the “shifting macro power balance”, which favours the bigger companies.
Businesses have no limit on how large they can get, meaning a “winner-takes-all” system has developed where bigger stocks face less competition and are “better positioned to beat their remaining small rivals”.
On top of this, political views seem to favour these larger firms, with smaller competitors regarded as “mere annoyances that make the world harder to manage and regulate.”
Quantitative easing (QE), where central banks started buying both corporate bonds and government bonds, is an example of this “bigger is better” push. This drove down the yields on bonds, which allowed “large companies to borrow at considerably lower rates than smaller competitors” to finance their growth plans.
These advantages have contributed to bigger businesses taking even greater chunks of market share, which is why global markets have become even more concentrated in their top 10, Evan-Cook said.
The “winner-takes-all economics” and emphasis on larger companies are reflected in valuations, meaning the largest stocks are now expensive. This trend means that investors could diversify by looking for opportunities further down the market-cap spectrum, he said.
“Small and mid-cap companies are available on highly appealing valuations, with less attendant risk too. I personally feel more comfortable having lower exposure to mega-caps than you’d find in a classic index, which means actively finding a way to move down the market cap scale,” he concluded.