


After years of tech-led growth and intermittent volatility, the IA North America sector remains a cornerstone for global investors.
But when markets swung wildly around Liberation Day in April it likely became clearer to investors that manager skill, not just market momentum, is crucial for delivering strong returns.
As such, in a continuation of an ongoing series, Trustnet identified funds in the IA North America sector with the highest information ratio scores over the past five years.
This ratio calculates the extent to which a fund’s performance derives from natural market fluctuations versus manager skill by dividing the portfolio’s active return by the tracking error. A score of 0.5 or higher indicates a better risk-adjusted performance.
To allow for comparison between funds across the sector, we selected the S&P 500 against which to calculate scores.
Across the sector 11 actively managed funds scored 0.5 or higher, as shown in the table below.
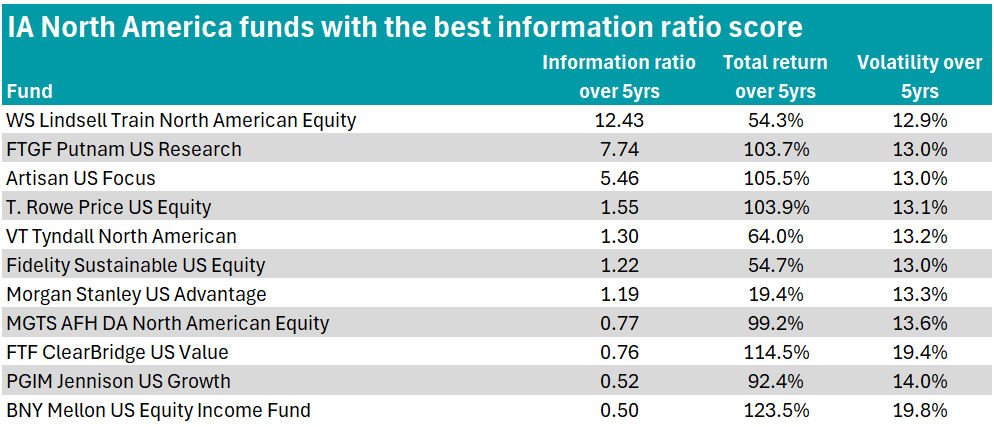
Source: FE Analytics
Top of the table with an information ratio score of 12.4 – the highest score by some distance – is WS Lindsell Train North American Equity.
The £40.5m fund aims to achieve growth in capital and income in excess of the MSCI North America index over at least five years.
It is managed by an FE fundinfo Alpha Manager – James Bullock – who joined Lindsell Train in 2010 and has run the fund since it was launched in 2020. Madeline Wright is the deputy manager.
WS Lindsell Train North American Equity has benefited from the recent artificial intelligence (AI) surge in the US, with Magnificent Seven mega-cap Alphabet the largest holding at 8.4% of the portfolio.
Other top holdings include American premium sports and entertainment company TKO (6.5%) and payment platform companies Visa (6.3%) and American Express (6.3%).
The fund also has the lowest five-year volatility of the 11 funds at 12.9%, with a five-year return of 54.3%.
Performance of the fund vs sector and benchmark over 5yrs

Source: FE Analytics
Second in the table is the $1bn FTGF Putnam US Research with an information ratio score of 7.7. The fund has delivered almost double the returns of the Lindsell Train fund for just 0.1 percentage point more of volatility.
Managed by Kathryn Lakin and Matthew LaPlant, it looks to generate long-term capital appreciation utilising both growth and value investment styles.
The biggest holdings in the portfolio are currently largely tilted toward growth, with the managers seemingly all-in on tech. The portfolio has a 7.5% position in Microsoft, 7.3% in Nvidia, 5.1% in Apple and 4.8% in Alphabet.
Despite this, the fund is comparatively underweight tech compared to the S&P 500 index at 34.9% versus 36.1%. It is also underweight financials at 12.2% versus 12.9%.
Meanwhile, FTGF Putnam US Research is overweight communication services and healthcare at 10.8% and 10.6% respectively compared to the index weightings of 10.1% and 9%.
Performance of the fund vs sector and benchmark over 5yrs

Source: FE Analytics
Rounding out the top three is Artisan US Focus. With an information ratio score of 5.5, the $280m fund also delivered a five-year return of 105.5%.
Christopher Smith has managed the high-conviction fund since launch in 2018. The management team seeks to construct a focused portfolio that can maximise alpha while limiting downside risk over the long term by identifying inflections in multi-year trends caused by changes in supply/demand dynamics, societal behaviour, technology, laws/regulations and business models.
The fund has around 30 holdings, with the top five making up 37.5% of the assets. These currently include big players in the AI race – Nvidia and Taiwan Semiconductor Manufacturing Company.
Performance of the fund vs sector and benchmark over 5yrs
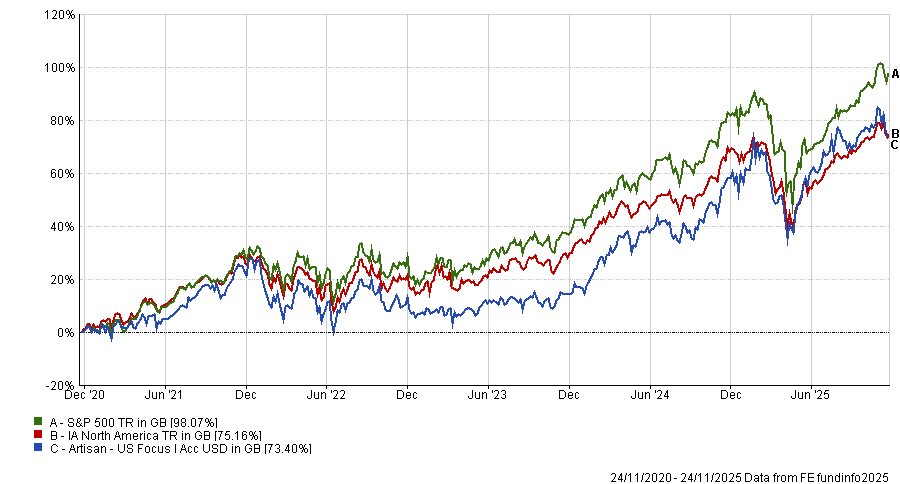
Source: FE Analytics
One of the biggest funds in the table is the £868.7m MGTS AFH DA North American Equity, which logged an information ratio score of 0.8, five-year return of 99.2% and volatility of 13.6%.
The fund utilises a multi-manager approach, meaning the portfolio is split into sleeves run by different teams. AFH Wealth Management, as the fund’s investment adviser and overseer of the strategy, sets the US equities-focused approach and monitors performance, adjusting allocations and sub-managers when necessary.
By blending different strategies under different managers, the idea is to ensure diversification and smoother returns.
Glenmede Investment Management has been one of the sub-managers since 2018, alongside JPMorgan Asset Management and T. Rowe Price, which have co-managed since 2020.
Similar to most funds in the table, it has a big focus on tech, with top holdings dominated by familiar names in the AI surge such as Nvidia, Broadcom and Alphabet.
Performance of the fund vs sector over 5yrs
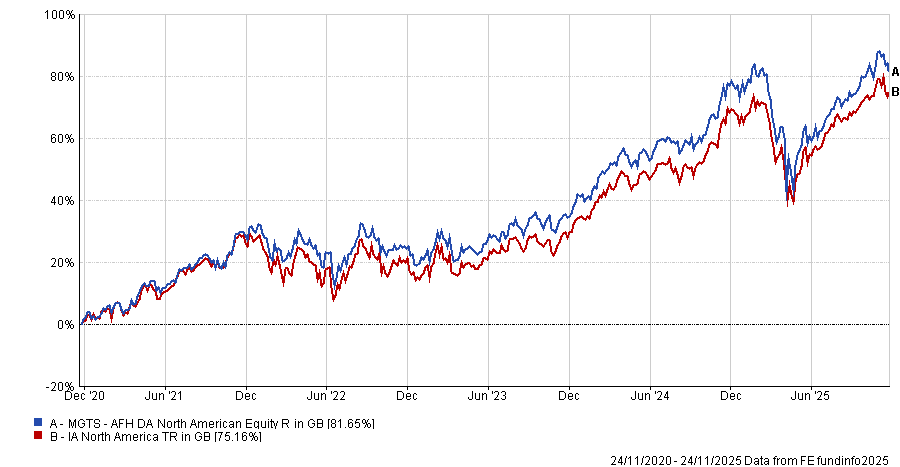
Source: FE Analytics
The highest five-year returns of the 11 were delivered by the $782.7m BNY Mellon US Equity Income Fund, which gained 123.5%. However, it was bottom of the table with an information ratio score of 0.5.
The fund aims to maximise returns from income and capital growth, targeting defensive stocks such as JPMorgan Chase, ExxonMobil and Bank of America. Its highest sector weightings are financials, industrials and healthcare at 27.1%, 16.1% and 16% respectively.
The management team for the fund is led by John Bailer, with Brian Ferguson and Keith Howell as deputies.
Performance of the fund vs sector and benchmark over 5yrs
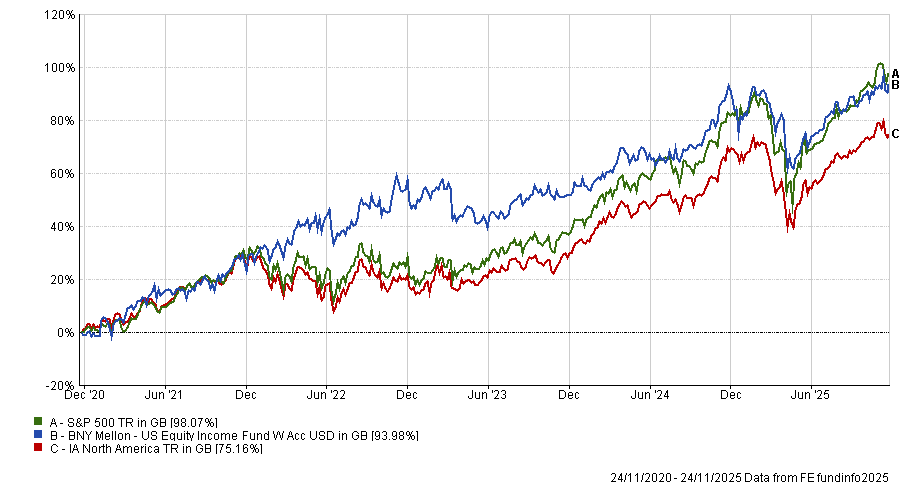
Source: FE Analytics
Other funds with top information ratio scores in the sector include T. Rowe Price US Equity, VT Tyndall North American, Morgan Stanley US Advantage, FTF ClearBridge US Value, PGIM Jennison US Growth and Fidelity Sustainable US Equity.