


Two dedicated ETFs have shown the greatest correlation to quality investing in recent years while a Fisher Investments strategy has done so with the highest total return, Trustnet research shows.
Quality investing focuses on companies with strong balance sheets, high returns on equity, stable earnings growth and low financial leverage. The idea is that businesses with these characteristics are more durable over time and tend to hold up better during periods of market stress than cheaper, more financially stretched companies.
The MSCI AC World Quality index returned 64.2% in sterling terms between May 2023 and April 2026, placing it between the growth index (69.7%) and the value index (47.8%) over the same period. Momentum investing led the investment factors with a 91.8% return. Quality and growth tracked momentum closely for much of this time, with their paths diverging only in the final months as momentum pulled well clear of both.
Performance of investment factors over 3yrs to end-Apr 2026
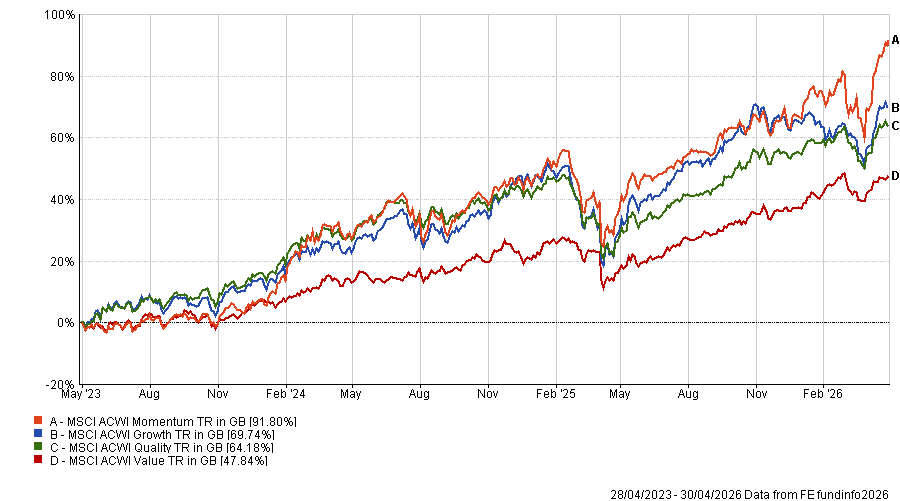
Source: FE Analytics. Total return in sterling between 1 May 2023 and 30 April 2026.
In this article, Trustnet ranked all funds in the IA Global sector by their three-year correlation to the MSCI AC World Quality index to identify those most closely aligned with the quality style.
The two funds with the highest correlation to the quality index are Xtrackers MSCI World Quality UCITS ETF and iShares Edge MSCI World Quality Factor UCITS ETF, both at 0.97.
Both are passive funds tracking the MSCI World Sector Neutral Quality index, which selects stocks based on three metrics: high return on equity, low leverage and low earnings variability. This methodology results in a portfolio concentrated in the US (a 73.4% weighting) and information technology (a 28.5% weighting).
This helps explain both the high quality correlation and the funds' second-quartile returns of 51% over the period, as US tech stocks have led the market over recent years on the back of the ongoing AI boom.
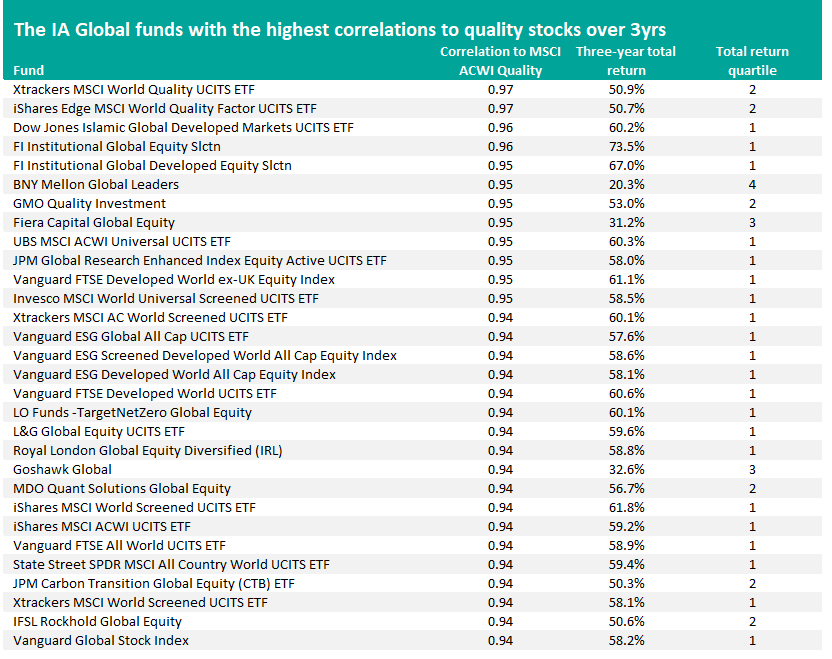
Source: Finxl. Correlation to MSCI ACWI Quality and total return in sterling between 1 May 2023 and 30 April 2026.
Of the funds in the above table, Fisher Investments' FI Institutional Global Equity Selection strategy has made the highest return. Managed by founder Ken Fisher and his team, the fund is currently underweight both the US and tech stocks.
Fisher Investments does not position itself as a quality manager, with its approach being primarily top-down and macro-driven. It analyses global economic conditions across countries, sectors and styles to determine what point it is in a market cycle and which areas of the market to favour.
However, in a 2024 paper, Fisher Investments set out in detail how quality fits into its process, using a proprietary quality Z-score built from return on equity, earnings variability and debt-to-equity ratio. This score ranks companies within the investable universe, with exposure adjusted according to the firm's view of the market cycle.
The firm also distinguishes its approach from standard index definitions of quality, which it criticises for relying solely on backward-looking data, and incorporates forward-looking analysis alongside historical metrics.
Performance of FI Institutional Global Equity Selection over 3yrs to end-Apr 2026
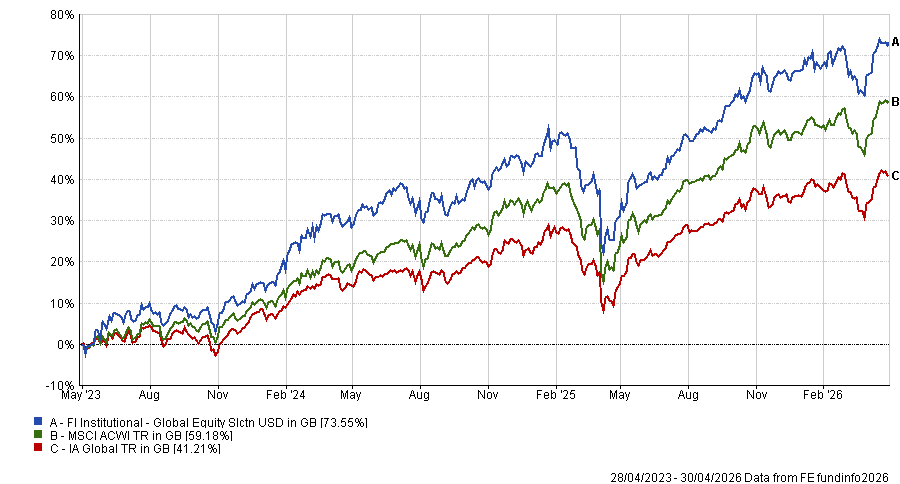
Source: FE Analytics. Total return in sterling between 1 May 2023 and 30 April 2026.
GMO Quality Investment is the most notable explicitly quality-oriented active fund in the table. Managed by Tom Hancock, Anthony Hene and Ty Cobb, it returned 53% over the three-year period, placing it in the second quartile of the IA Global sector.
Analysts at FE Investments said: "Since the team took over in 2015, selecting the right companies has been the main driver of returns, with sector choices also helping.
"Stock picking in technology and healthcare has been particularly strong since 2019, important given these are the fund's largest positions. A focus on steadier names has also helped the fund hold up better in downturns, including after the 2020 Covid sell-off and the tech pullback in August 2024."
The most common theme among the funds with the highest correlation to the quality index is broad market exposure: Vanguard FTSE All World, iShares MSCI ACWI, State Street SPDR MSCI All Country World, UBS MSCI ACWI Universal, L&G Global Equity and Vanguard Global Stock Index are all essentially cap-weighted global index trackers.
Their high quality correlation reflects the dominance of US technology mega-caps within market-cap-weighted indices. Companies such as Apple, Microsoft and Nvidia score strongly on quality metrics including return on equity, earnings stability and balance sheet strength, while their sheer size means they influence the style bias of any portfolio that holds the market in proportion.
A second major theme is ESG and ethical screening, which appears prominently in both the growth and quality correlation lists.
Vanguard ESG Global All Cap, Vanguard ESG Screened Developed World All Cap Equity Index, iShares MSCI World Screened, Xtrackers MSCI AC World Screened, Invesco MSCI World Universal Screened, LO Funds TargetNetZero Global Equity and JPM Carbon Transition Global Equity appear in the table, as does the Invesco's Dow Jones Islamic Global Developed Markets ETF.
The reason screened funds correlate with the quality index follows similar logic to their correlation with growth.
Standard ESG screens remove large portions of energy, materials, utilities and traditional financials. These tend to be lower-quality sectors on measures such as return on equity or earnings stability, so what remains is a portfolio tilted towards technology, healthcare and consumer staples, all of which score highly on quality metrics.