


Momentum investing involves buying stocks that have recently outperformed on the expectation that strong price trends will persist over the medium term. Rather than assessing a company's fundamental value or quality, momentum strategies follow price signals and rotate into whatever has been working and away from whatever has not.
Of the four main investment factors, momentum was the strongest performer over the three years to the end of April 2026. The MSCI AC World Momentum index returned 91.8% in sterling terms over the period, well ahead of its growth (69.7%), quality (64.2%) and value (47.8%) counterparts.
However, momentum is also the factor most prone to sharp reversals: when market leadership changes quickly, heavily momentum-oriented portfolios can suffer steep losses in a short space of time. The drawdown visible across all four factors in early 2025 was particularly pronounced for momentum, before the index recovered strongly to finish ahead of its peers.
Performance of investment factors over 3yrs to end-Apr 2026
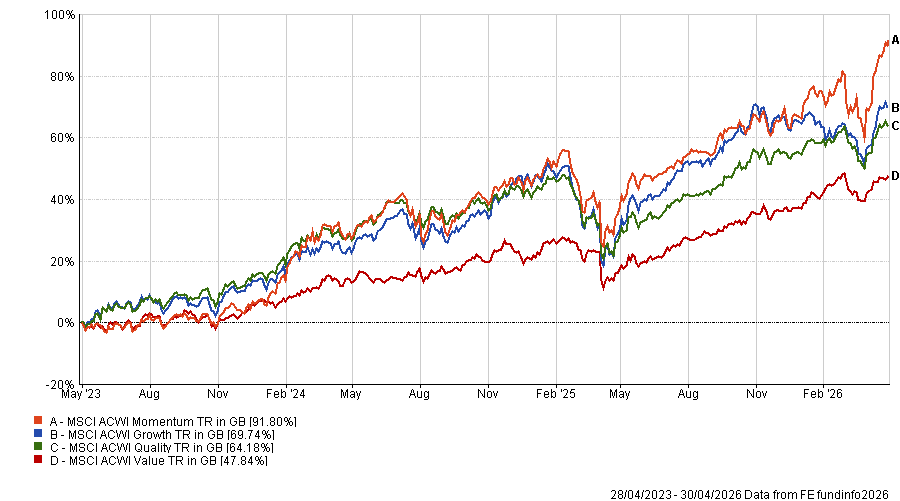
Source: FE Analytics. Total return in sterling between 1 May 2023 and 30 Apr 2026.
In this article, Trustnet ranked all funds in the IA Global sector by their three-year correlation to the MSCI AC World Momentum index to identify those most closely aligned with the momentum style.
The two funds with the highest correlation to the momentum index are iShares Edge MSCI World Momentum Factor UCITS ETF and Xtrackers MSCI World Momentum UCITS ETF, both at 97.7%. It should come as little surprise that ETFs designed to track the momentum factor have the highest correlation with the index.
What might surprise, however, is the fact that both funds have delivered around 78% over the three-year period, trailing MSCI AC World Momentum by more than 10 percentage points (although still putting them in the IA Global sector's first quartile).
Both are passive strategies that track the MSCI World Momentum index, which only includes momentum stocks from developed markets. The MSCI AC World Momentum index, on the other hand, includes emerging market stocks and features SK Hynix, Samsung Electronics and Taiwan Semiconductor Manufacturing among its top 10 constituents. These stocks have surged of late, thanks to the AI-driven semiconductor boom.
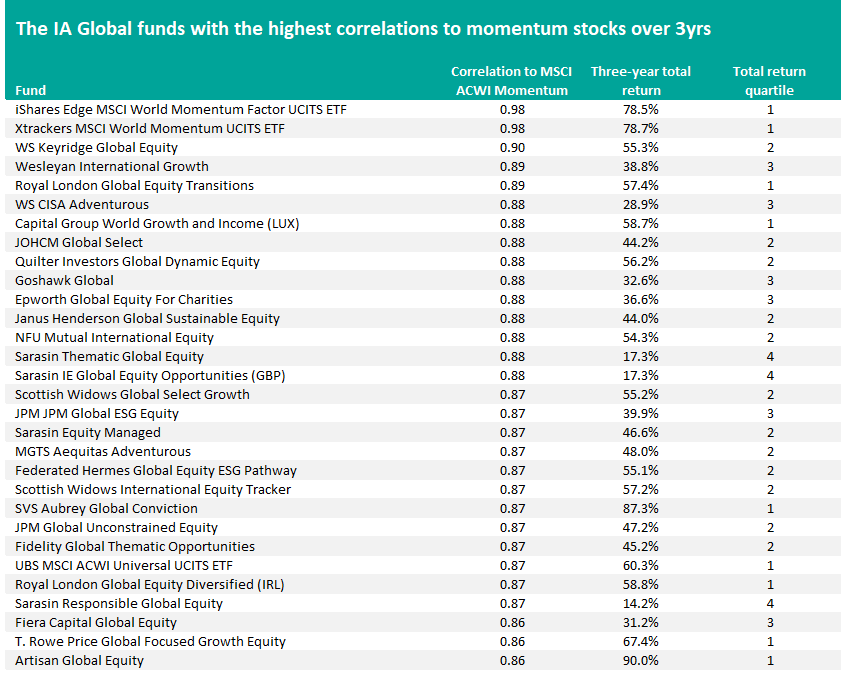
Source: Finxl. Correlation to MSCI ACWI Momentum and total return in sterling between 1 May 2023 and 30 April 2026.
The two highest-returning funds in the table of the sector's most correlated are Artisan Global Equity (up 90% over the three years) and SVS Aubrey Global Conviction (up 87.3%).
SVS Aubrey Global Conviction, managed by Andrew Dalrymple since 2007, has a concentrated, high-conviction approach and invests in companies expected to be producing earnings growth of at least 15% over a two-year time horizon, have a 15% forecast return on equity and are highly cash generative.
More than a third of the portfolio is in industrials with a similar amount in information technology, including Taiwan Semiconductor Manufacturing, SK Hynix, Broadcom and Samsung.
Artisan Global Equity, run by Mark Yockey, Andrew Euretig, and Charles Hamker since 2012, invests in companies positioned to benefit from several long-term secular growth trends. One of these themes is electrification, which is currently surging because of demands from data centres, electric vehicles, artificial intelligence and cloud computing, and defence and aerospace, which is benefitting from pledges by governments around the world to boost defence spending.
Performance of SVS Aubrey Global Conviction and Artisan Global Equity over 3yrs to end-Apr 2026
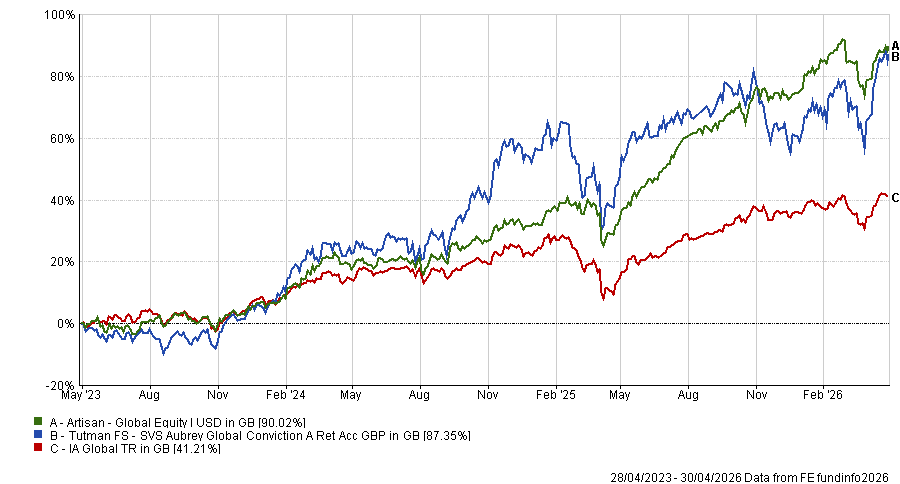
Source: FE Analytics. Total return in sterling between 1 May 2023 and 30 April 2026.
The most credentialled active fund in the table is T. Rowe Price Global Focused Growth Equity, managed by David Eiswert and Nabil Hanano. It returned 67.4% over the three-year period, placing it in the sector's first quartile, and carries a Square Mile A rating, Rayner Spencer Mills Research approval, a place on the FE Invest Approved List and an Alpha Manager designation for Eiswert.
Analysts at Titan Square Mile said: "This fund has a distinct bias towards large-capitalised growth stocks, but it operates within sensible parameters that should provide investors with broad regional and industry exposure to companies in both developed and emerging countries.
"The fund has demonstrated an ability to deliver strong relative performance in rising markets, but this is likely to come at the expense of underperforming the index during times of market stress. Despite this, we think investors will be well served over the course of a full market cycle."
JOHCM Global Select, managed by Christopher Lees and Nudgem Richyal since 2008, is another rated by analysts.
Rayner Spencer Mills Research said: "A disciplined buy-and-sell approach underpins the team's portfolio management. Stocks trending downwards are avoided, and winners are trimmed back to equal weight when they grow significantly. Sales are decisive, with holdings sold entirely when fundamentals or technical indicators weaken, or ESG standards are no longer met."
ESG and sustainable funds form another clear theme in the list of global funds with a high correlation to momentum stocks: Janus Henderson Global Sustainable Equity, Federated Hermes Global Equity ESG Pathway and JPM Global ESG Equity appear in the table.
The connection between ESG screens and momentum correlation follows the same logic as their correlation with growth and quality as screens that remove energy, materials, utilities and traditional financials consistently point portfolios towards technology stocks, which have been among the strongest momentum plays of the three-year period.