






The UK, China and Brazil are among the world’s cheapest markets while Taiwan is the most expensive, research from Trustnet shows.
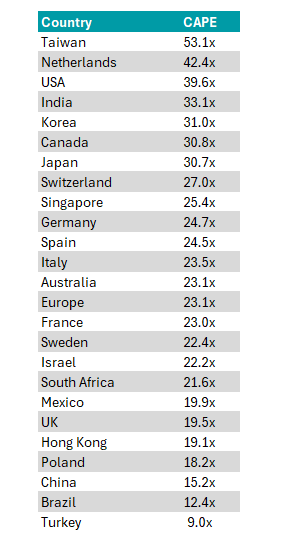
To examine this, Trustnet looked at the cyclically adjusted price-to-earnings (CAPE) ratio of 25 different indices. CAPE divides an index’s price by the average of 10 years of earnings. We used data to the end of August from Barclays, which used the relevant MSCI index for each of the markets below.
At the top end of the chart, Taiwan is the most expensive market in the world, with a CAPE of 53.1x. The market is dominated by TSMC, which has ballooned in size since the outbreak of the AI trade. Over the past three years, shares are up 333%, as the chip manufacturer has blossomed.
Viewed as an integral part of the AI supply chain, the stock has rocketed higher. It has also become a significant part of major indices, representing 15.1% of the MSCI Emerging Markets index, 16.9% of the MSCI Asia Pacific ex Japan benchmark and some 55.2% of the MSCI Taiwan market.
In March, Michael Bourke, who runs the M&G Global Emerging Markets fund, explained the stock had become so large that it was almost impossible for active managers to avoid it.
“Global managers own it by choice but emerging market managers own it by benchmark compulsion,” he told Trustnet.
Markets dominated by companies viewed as AI winners were the main names at the head of the expensive list. The Netherlands, in second place, is largely dependent on the fortunes of ASML, the world’s sole manufacturer of extreme ultraviolet lithography machines used in chip manufacturing.
Europe’s largest company, the stock makes up 4.5% of the MSCI Europe index but 51.5% of the MSCI Netherlands benchmark.
Korea, another market dominated by a handful of AI names (in particular Samsung and SK Hynix), was the fifth most-expensive market of those looked at.
Source: Barclays
In third place is the US, which is led by the Magnificent Seven. It sat on a CAPE of 39.6x at the end of August, according to the Barclays figures.
Perhaps the most surprising ‘expensive’ market was India, with the MSCI India on a CAPE ratio of 33.1x. The market has had a difficult time recently and is down 11.5% so far in 2026, adding to its 4.5% drop in 2025. Investors have been quick to label India an AI loser, as it does not house any of the world’s leading tech companies.
Robin Parbrook, co-manager of Schroder Asian Total Return, said earlier this month that despite the drop, it remains expensive.
“We like the top-down – it should stay Asia's fastest-growing economy for the foreseeable – but we cannot find stocks at the right price. Indian earnings consistently disappoint versus forecast, and the market is currently pricing in around 18-20% EPS [earnings per share] growth a year, which is not realistic given the index's heavy weighting to IT services, which are being disrupted by AI, along with fast-moving consumer goods names facing the same private-label and quick-commerce pressures we're seeing everywhere else,” he said.
Being expensive is not a sign to sell necessarily. In some cases, there are opportunities. For example, Joe Bauernfreund, who runs the £1.3bn AVI Global trust, is investing in Korea despite his valuation-centric approach.
“Korea is a market that a lot of investors look very superficially at the high level and they say: ‘Yeah, the Kospi has gone up a lot, I've missed the boat’. But beneath the surface, there's a lot more to the story, and that's really what gets us excited,” he told Trustnet.
Turning to the cheapest markets, emerging market countries sit at the bottom of the pile. Turkey is on a CAPE of 9x, the only one of the 25 looked at in single digits.
Returns tend to be dictated by a combination of macroeconomic factors such as inflation, central bank policy and currency. Over the past few years it has been a boom or bust proposition for UK investors.
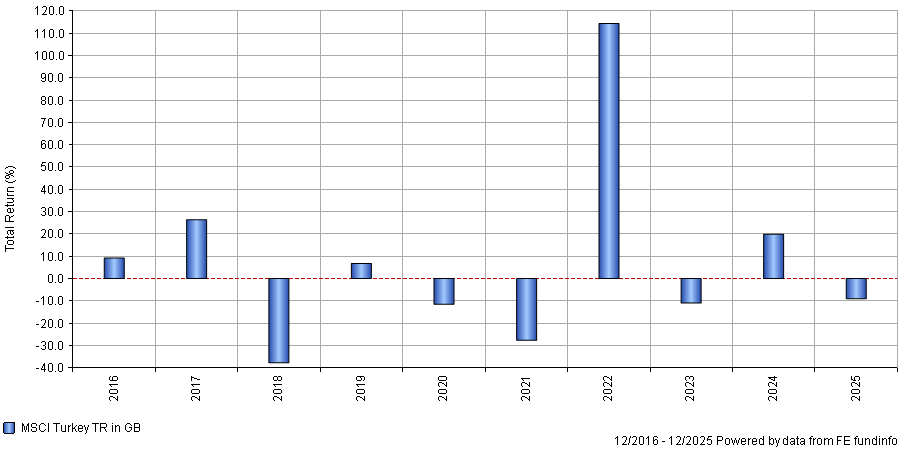
In sterling terms, the MSCI Turkey is up 21.7% in 2026 so far, having fallen 9% last year. The chart below shows its calendar year swings from heavy losses to triple-digit gains.
Performance of MSCI Turkey over 10 calendar years
Source: FE Analytics
Second is Brazil on a CAPE of 12.4x. At the start of the year, the market was highlighted by Karnail Sangha, co-manager of Robeco Emerging Stars Equities fund, who said it offers a mix of easing inflation and the possibility of rate cuts ahead.
China is the third-cheapest market with a CAPE of 15.2x. The country has slid in relevance recently, although it remains the third-largest constituent of the MSCI Emerging Markets index and MSCI AC Asia Pacific ex Japan benchmark.
Invesco Asian co-manager William Lam said recently that Asian markets – Korea and Taiwan in particular – have never been more expensive but noted that “China is extremely cheap”. This, he said, presented his fund with a “massive opportunity”.
The UK is the cheapest developed market on the list ranking fifth overall with a CAPE of 19.5x. It has been unloved by investors for some time, with funds dedicated to the domestic market experiencing outflows for several years. A further £601m was removed in August, according to Calastone data.
However, the market has performed well this year, thanks in large part to a rise in merger and acquisition (M&A) activity. Earlier in the summer, James Lowen, manager of the JOHCM UK Equity Income fund, told Trustnet his fund was “under attack” from an M&A “frenzy” that has taken place in the past 18 months or so.
“We could end the year with 10 [takeovers for FTSE 100 companies], which is 10% of constituents. If nothing changes, then there's not going to be much left in 10 years,” he warned.