


Model portfolio research is scarce but data this week from Buckingham Research shed some light on just how tricky it can be to select consistent winners.
In the chart below, each dot represents a balanced model portfolio service (MPS) with a 40-60% equity range. It ranks the returns over two discrete three-year periods: 1 January 2019 to 31 December 2021; and 1 January 2022 to 31 December 2024.
MPS providers with a sustainable focus and those that have a predominantly passive approach were excluded, with only active MPS providers studied.
The big dot on the side was the best performer in the first period but tanked to 57th (out of 69 in total) in the following three years.
Performance of balanced MPS funds over two 3yr-periods
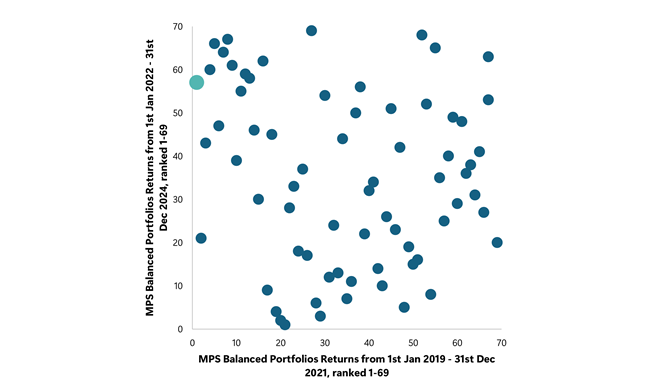
Source: Buckingham Research
Sam Buckingham, author of the research, said: “You can see from the cluster in the top-left of the chart that this fall from grace is not uncommon – all those top-performing portfolios in the first three-year period all ended up dropping down towards the bottom of the leaderboard.”
This may not be surprising to some, as the conditions of the first three years studied (the Covid years) were very different to the high interest rate and inflation environment that followed in the latter three years.
However, further analysis shows the top performers in the first three years were worse than the average fund in the sector over the entire timeframe.
“This trend holds true over longer discrete periods – we replicated it for five-year periods and the result is the same. The trend is not a freak one-off either. Back-testing an additional discrete three-year period and you get the same result,” said Buckingham.
So why is this? He argued there are a number of reasons, including concentrated exposure to certain factors such as tech. Asset allocation will also be key. In this study there is a 20 percentage point band for equity allocations, so relative performance is largely driven by where funds sit within this range.
While this is a model portfolio study, its conclusions could, in theory, be extrapolated to any investors who use a balanced multi-asset approach in their own portfolios, particularly those in the IA Mixed Investments sectors where equities are banded.
It could be even more crucial here, as the bands range between 35 and 45 percentage points wide, meaning there is likely to be a much larger spread of returns.
When it comes to equity investing, many have moved towards the momentum-driven US market. Doing so at any point in the past 15 years would arguably have been the best decision an investor could have made.
But it seems with multi-asset investing, where funds use a mixture of bonds, equities and alternatives, the potential for wildly varying results is much higher.
Whether investors make changes to their portfolios or not, it is clear that they must remain vigilant and review their offerings regularly.
This is doubly so for independent financial advisers (IFAs) who are charging clients for their services and should be proactively making sure the investment they bought years ago remains the best option for the people willing to hand over their money to them.