


Stock markets reached new record highs in the third quarter of 2025 as tech stocks and emerging markets continued to rally despite the heightened uncertainty that has defined the year so far.
The easing of trade-war tensions between the US and its trading partners lifted a major drag on markets over the third quarter. Investors responded positively to the reduction in tariff threats, which had weighed on earnings expectations and cross-border supply chains earlier in the year.
At the same time, the Federal Reserve shifted to a rate-cutting stance as inflation showed clearer signs of slowing. Lower policy rates supported equity valuations by reducing borrowing costs and boosting risk appetite.
Performance of asset classes in Q3 2025
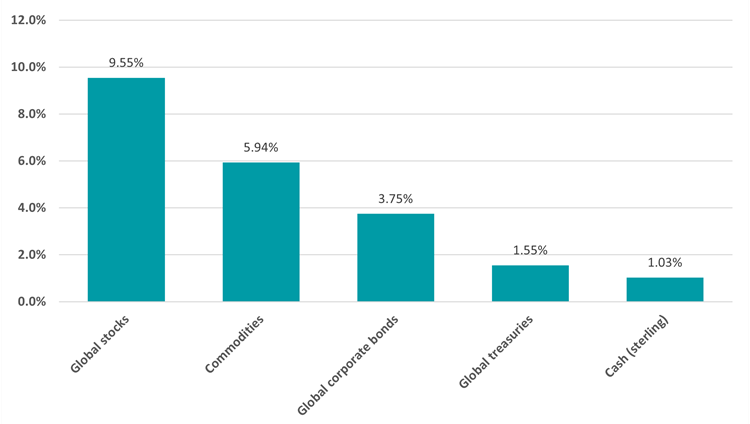
Source: FinXL. Total return in sterling between 1 Jul and 30 Sep 2025.
Global stocks led the third quarter with a 9.6% return; the S&P 500, Nasdaq Composite and FTSE 100 all reached new record highs. Easing recession fears and resilient corporate earnings bolstered investor sentiment, with artificial intelligence stocks and Fed rate cut expectations adding to the momentum.
Rob Morgan, chief analyst at Charles Stanley, said: “Since Trump’s re-election, heightened unpredictability has become a defining market theme. The erratic nature of policy announcements has made it increasingly difficult for investors to forecast economic conditions and corporate profitability. This uncertainty has extended into boardrooms, where senior executives face tough decisions about capital allocation and future investment amid a murky macroeconomic outlook.
“Despite these challenges, markets made solid progress in the third quarter. The second-quarter earnings season was broadly upbeat, helping to reassure investors. At the same time, inflation, while still elevated, has not yet shown a significant response to the tariff measures – though this could change later in the year as the full impact of trade policy shifts is felt.”
Corporate bonds posted a 3.8% gain while government bonds returned just 1.6%, as credit outperformed sovereign debt while risk appetite remained strong. Commodities delivered a 6% return.
Performance of regions in Q3 2025
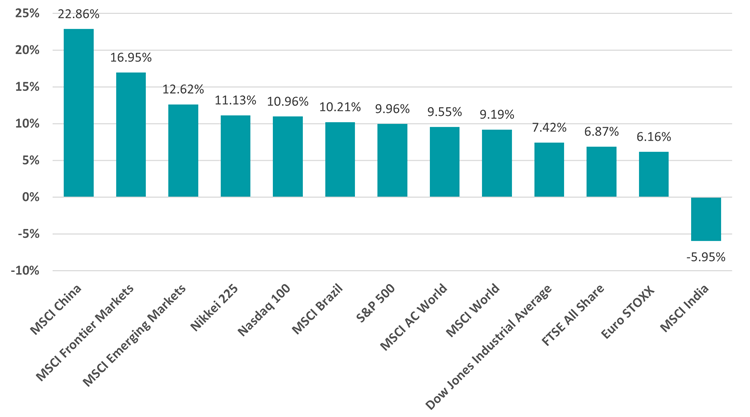
Source: FinXL. Total return in sterling between 1 Jul and 30 Sep 2025.
As the chart above shows, emerging market equities made the strongest gains over the past three months, led by a significant rally in Chinese stocks. India, however, was down during the period on the back of a pullback from foreign investors and tariffs from the US.
Zara Nokes, global market analyst at JP Morgan Asset Management, said: “Chinese tech stocks rallied sharply, with the Hang Seng Tech index gaining 22.1% over the quarter and up 46% year-to-date. Policy support for domestic chipmakers, alongside an acceleration in AI spend and product rollout from some of China’s biggest tech names fuelled the rally. More broadly, easing trade tensions with the US and hopes that China’s ‘anti-involution’ policy would shore up the domestic economy supported the wider market.”
US markets steadied after a rough first half and outperformed global indices. But European equities, which investors had previously been flocking to, lagged behind.
Nokes added: “The lacklustre performance of German equities acted as a drag on overall European performance, with the MSCI Germany Index falling 1.2%. Despite a period of political instability, French stocks rose over the quarter, with the CAC 40 Index up 3.3%.”
Performance of investment factors in Q3 2025
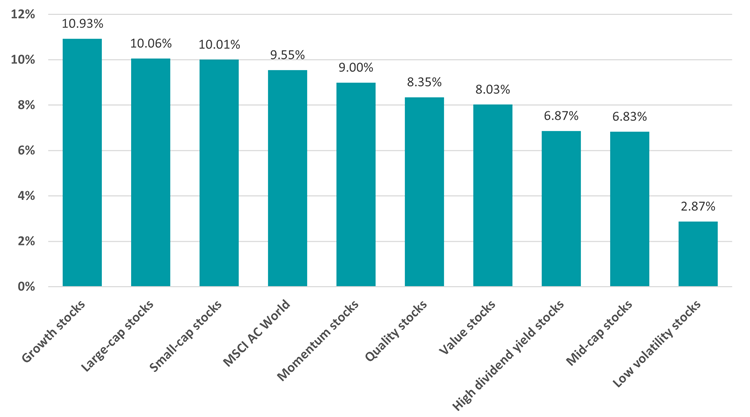
Source: FinXL. Total return in sterling between 1 Jul and 30 Sep 2025.
Growth stocks led the factor performance with a 10.9% return, closely followed by large-cap stocks at 10.1% and small-cap stocks at 10%, demonstrating broad-based strength across company sizes. This performance reflects the technology-driven rally that favoured growth-oriented companies, particularly those benefiting from artificial intelligence themes.
Low volatility stocks underperformed with a return of just 2.9%, highlighting how investors favoured risk-taking over defensive positioning. This reflects the market's risk-on sentiment, with investors willing to lose the safety of low-volatility holdings for the higher returns available from more dynamic growth and cyclical factors.
Performance of industries in Q3 2025
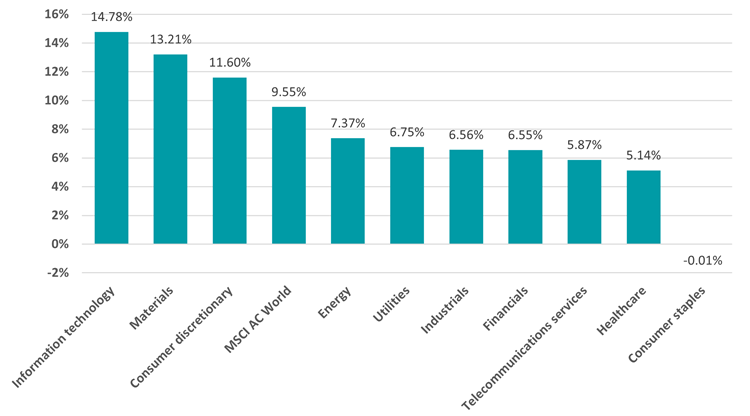
Source: FinXL. Total return in sterling between 1 Jul and 30 Sep 2025.
Information technology dominated the quarter with a 14.8% return, followed closely by materials at 13.2%, highlighting how the AI-driven rally powered tech stocks while commodity-related sectors benefited from supply concerns. Consumer discretionary also performed strongly with 11.6% gains, reflecting robust consumer spending and confidence in economic recovery prospects.
Consumer staples were flat, as investors rotated away from defensive sectors towards more cyclical opportunities during the quarter's risk-on environment. The wide performance gap between tech leaders and defensive sectors like healthcare (5.1%) and telecoms (5.9%) shows how investors clearly favoured growth and cyclical exposure over traditional safe-haven plays.
Performance of thematics in Q3 2025
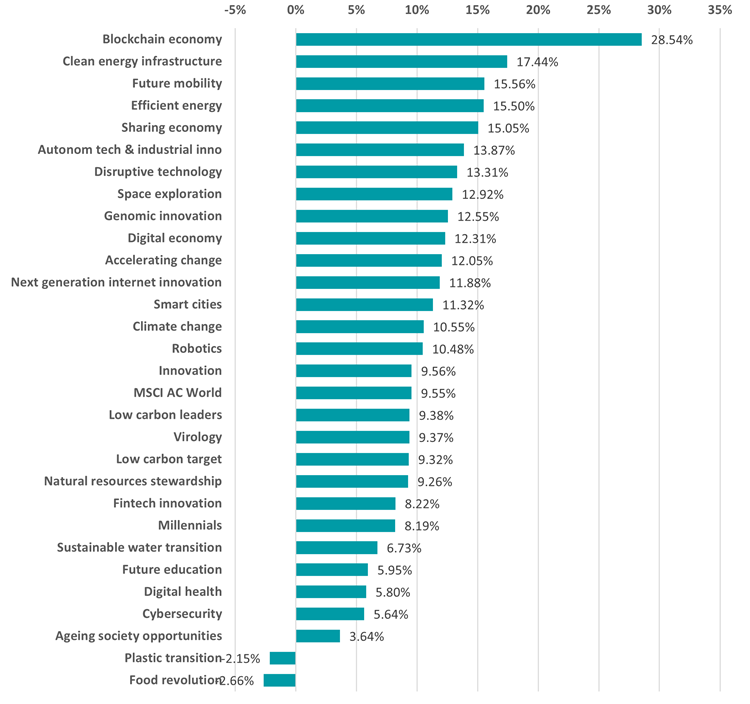
Source: FinXL. Total return in sterling between 1 Jul and 30 Sep 2025.
Blockchain economy stocks delivered the standout thematic performance with a 28.5% return during the third quarter of 2025, significantly outpacing the broader market and other technology themes. This reflects renewed investor enthusiasm for cryptocurrency and distributed ledger technologies, driven by regulatory easing and institutional adoption.
Performance of commodities in Q3 2025
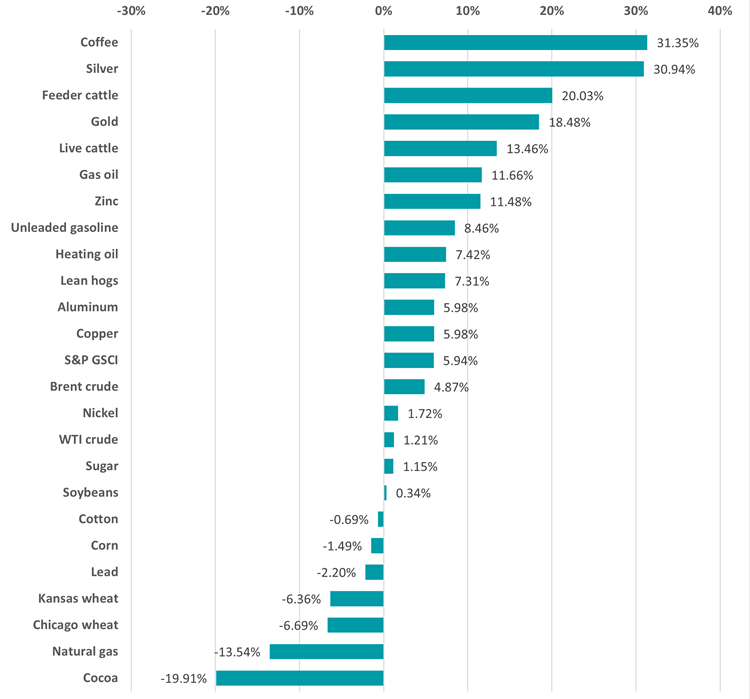
Source: FinXL. Total return in sterling between 1 Jul and 30 Sep 2025.
Coffee, silver and feeder cattle were the top-performing commodities of the past quarter, but investors focused on the rise of safe-haven metal gold.
Morgan said: “Gold continued its upward trajectory, hitting new all-time highs above $3,800/oz. The metal’s safe-haven appeal was reinforced by ongoing global uncertainty, including trade tensions, currency volatility and concerns over central bank independence.
“Strong demand from central banks, institutional investors, and households — particularly in Eastern markets — has underpinned the rally. In addition, fears that political interference in monetary policy could stoke inflation have added to gold’s allure.”
Performance of Investment Association funds in Q3 2025
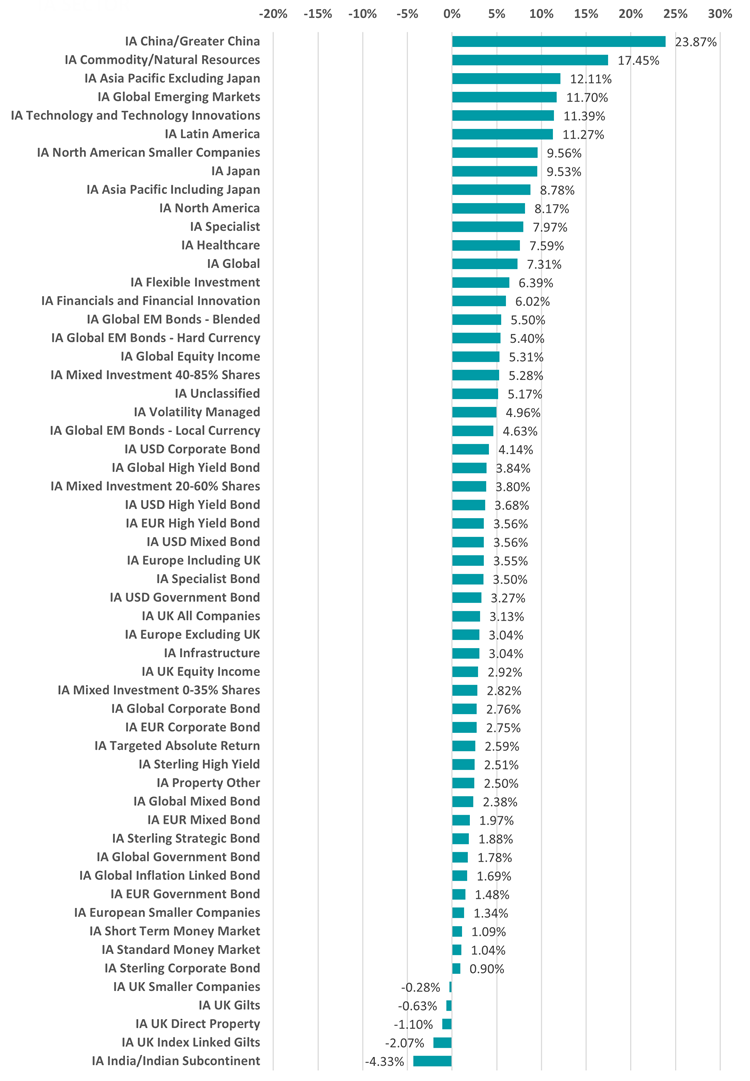
Source: FinXL. Total return in sterling between 1 Jul and 30 Sep 2025.
Fund performance over the third quarter mirrors the trends seen in wider markets, with IA China/Greater China funds’ average return of 23.9% powered by China's stimulus-driven recovery and the extension of the US-China trade truce.
Wider Asian and emerging market equity funds also performed strongly, apart from Indian specialists which suffered a 4.3% loss. US and tech funds also had a decent quarter and outperformed their global peers, while UK and European funds trailed behind with 3% average returns.
The best performing individual funds over the three-month period were Invesco ChiNext 50 UCITS ETF (up 65.2%), UBS Solactive US Listed Gold & Silver Miners UCITS ETF (55.6%) and Tutman FS SVS Baker Steel Gold & Precious Metals (55.3%). Some 14 of the top 15 funds invest in gold or precious metals.
Similar trends were seen in the Association of Investment Companies universe, which was led by the IT China/Greater China (up 31.5%), IT Commodities & Natural Resources (29.7%) and IT Technology & Media (18.9%) sectors.