


The stock markets are full of expressions of all kinds: don't catch a falling knife; the trend is your friend; buy the rumour, sell the news … But there is one that truly endures: sell in May and go away. Not a year goes by without analysts and the media trotting it back out. So, how true is it?
The question is particularly pertinent this year, given the dramatic movements in stock markets following Donald Trump's announcements on tariffs, disappointing US economic figures and mixed corporate results.
While gold and the Swiss franc benefited from the uncertainty, equities, particularly cyclical and technology stocks, experienced erratic movements. Against this backdrop, doubts about global growth are weighing on risk appetite.
It is in this ambivalent context that the ‘selling in May’ debate is resurfacing.
What history tells us
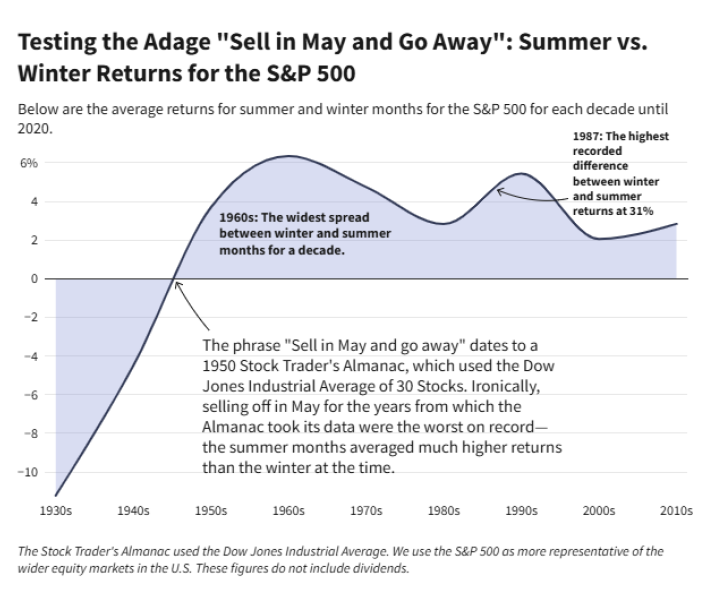
Historical data going back to 1928 shows that the best performing six-month rolling period, on average, runs from November to April. Hence the saying that investors should ‘sell in May and go away’ – and come back in November.
In an ‘average’ year, the S&P 500 index experiences its first significant correction in mid-May, with the index not exceeding these levels again until early July. An upward trajectory then resumes until a second major correction takes place in September. This ‘pause' tends to last longer, with the market not breaking through these levels until mid-December. The ‘Santa rally’ then takes hold.
In terms of volatility, there is no doubt that the average year sees volatility increase the most between mid-September and mid-November, with October being historically quite extreme.
There is therefore some truth in the saying that May sees the first correction of the year on average, but July is historically one of the best months of the year.
Since 1990, the S&P 500 has gained an average of around 3% from May to October. By comparison, the average gain was around 6.3% from November to April. This outperformance is observed not only for US large-caps, but also for small-caps and global equities – as measured by the respective S&P indices.
In addition, strategies that rotate between different market capitalisations have historically performed even better on average.
What’s behind this ‘theory’?
There are several reasons for the ‘sell in May and go away’ theory. Investors are convinced that at the start of the summer, the absence of market participants due to the holidays can create an environment of low volume and low returns.
The seasonality of investment flows may also persist because of year-end bonuses in the financial and corporate sectors, with the mid-April deadline for filing US tax returns a possible contributing factor.
The average gain in the Dow Jones over the past 10 years for the November to April period was 27.5%, compared with an average of 2.9% for the May to October periods that followed.
The post-election context
This year began with a major political change in the US. Historically, stock markets tend to rebound after the election when a Republican president who favours tax cuts takes office. But since January, US indices have been extremely volatile on the back of promises of changes in the tax code but also uncertainties over trade policies, and this could continue between May and October. We will therefore have to keep a close eye on developments in international trade negotiations and their impact on investor confidence.
Why are there flaws in the theory?
More often than not, shares tend to make gains throughout the year, so selling in May generally doesn't make much sense. History shows that the opportunity cost of periodically exiting and re-entering the market can be significant.
What's more, the ease with which you can monitor your investments (compared with decades ago, when this theory of the calendar was first created) means that you can more easily follow the market and make changes to your investments at any time of the year.
Finally, it should also be remembered that yields have varied widely, not only between the periods of November to April and May to October, but also within these periods.
Would you rather think about rotation?
Since 1990 there has been a clear divergence in sector performance between the two periods – with cyclical sectors easily outperforming defensive sectors, on average, during the ‘best six months’ of the year. In particular, the consumer discretionary, industrials, materials and technology sectors outperformed the rest of the market from November to April. On the other hand, defensive sectors outperformed the market from May to October during this period.
Based on these observations, the investment research provider CFRA created an equal-weighted seasonal turnover index in April 2018.
It is also important to recognise that calendar-based stock market trends such as ‘sell in May’ do not take into account the uniqueness of each period: the economic environment, the business cycle and the market that differentiate the present from the past.
Ultimately, investors need to look at the market over the medium to long term, which takes away some of the stress.
John Plassard is a senior investment specialist at Mirabaud Group. The views expressed above should not be taken as investment advice.