


Markets hate uncertainty, but volatility has been a common feature of the investment landscape for the past half a decade, in which markets have been shaken by everything from a global pandemic to the outbreak of war.
This year, uncertainty has continued as markets have had to grapple with US president Donald Trump’s fluctuating and unclear approach to trade threatening a full-blown trade war with China.
As such, in the first part of a new series, Trustnet examines market capitalisation, investment style and the performance of active and passive funds to determine the ‘ultimate way’ to invest in each major market since the start of 2020. Here we begin with the UK.
While past performance is not a guarantee of future returns, if volatility is here to stay, it may be helpful for investors to know what has done well in the past five years of market uncertainty.
Market capitalisation and investment styles
Of the three main UK market indices, the large-cap FTSE 100 is the best performer, up 35.3% since the start of 2020. Investors have sought the relative safety of larger companies in the past few years, as blue-chips tend to be more international and better prepared to deal with market shocks.
The make-up of the UK market, in particular, has been beneficial here. It is made up predominantly of large banks, which were boosted by rising interest rates, and oil majors, which have rocketed as the oil price jumped on the back of Russian sanctions following the country’s invasion of Ukraine.
As investors have taken risk off the table, other areas have struggled. The small-cap Deutsche Numis Smaller Companies index is up by 9%, a difference of 26 percentage points, while the mid-cap FTSE 250 is up by just 2.7% as investors have shunned domestic names.
Performance of indices since 2020
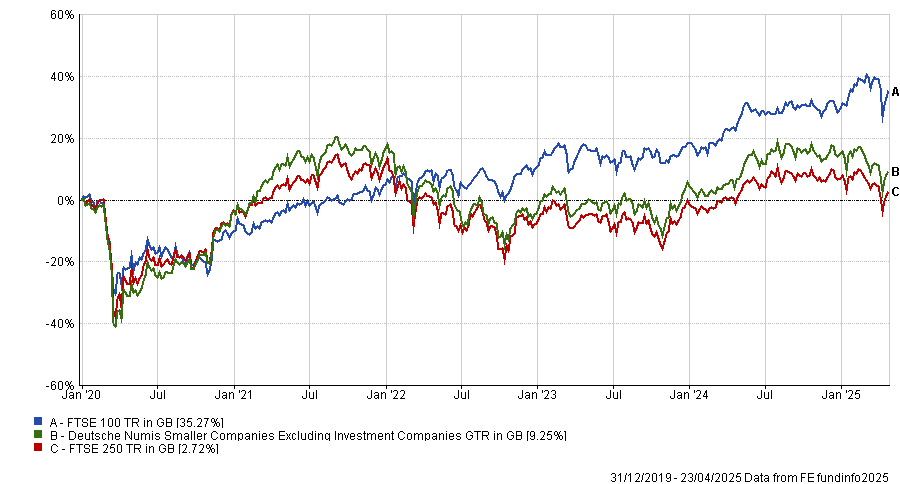
Source: FE Analytics
Turning to investment styles, large-caps again triumphed, with MSCI United Kingdom Large Value and MSCI United Kingdom Large Growth topping the chart with a return of 43.3% and 40.5%, respectively, suggesting style was less of a factor than market capitalisation.
However, value was the clear winner across the entire market spectrum, with the style also outperforming in the small-cap space (the MSCI United Kingdom Small Value was up by 4.1%, while the growth index tanked by 11.2%). The only exception was in mid-caps, where this trend reversed.
Performance of indices since 2020
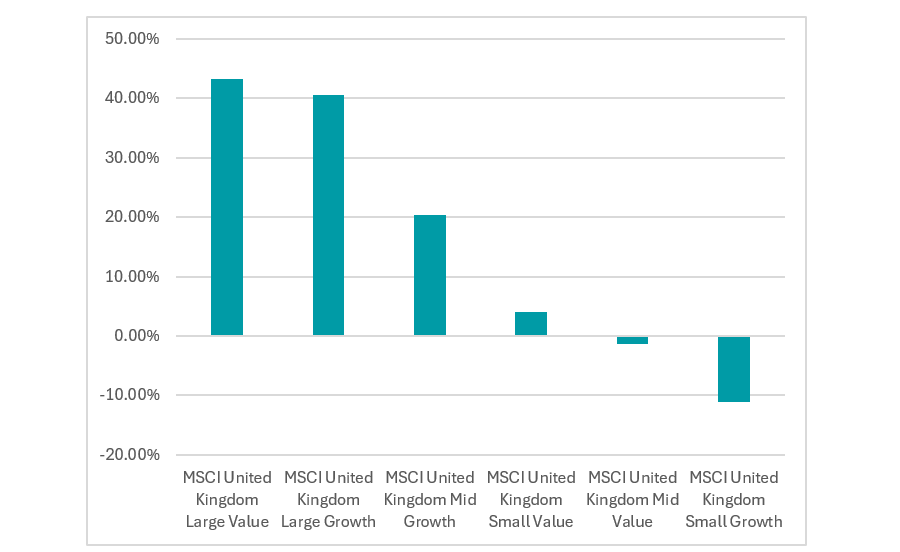
Source: FE Analytics.
Active vs passive
Having established that a large-cap value fund was the best way to invest in the UK over the past five years, how did active funds perform versus their passive counterparts?
Across all three IA UK equity sectors, the average fund failed to beat the most common UK benchmark – the FTSE All Share – which surged 30.2% since the start of 2020. The IA UK Equity Income sector average came closest to this result, up 22.3%, while the IA UK All Companies sector peer group is up by 15.6% and the IA UK Smaller Companies sector lost 3.3%.
Performance of IA Sectors vs the benchmark since 2020
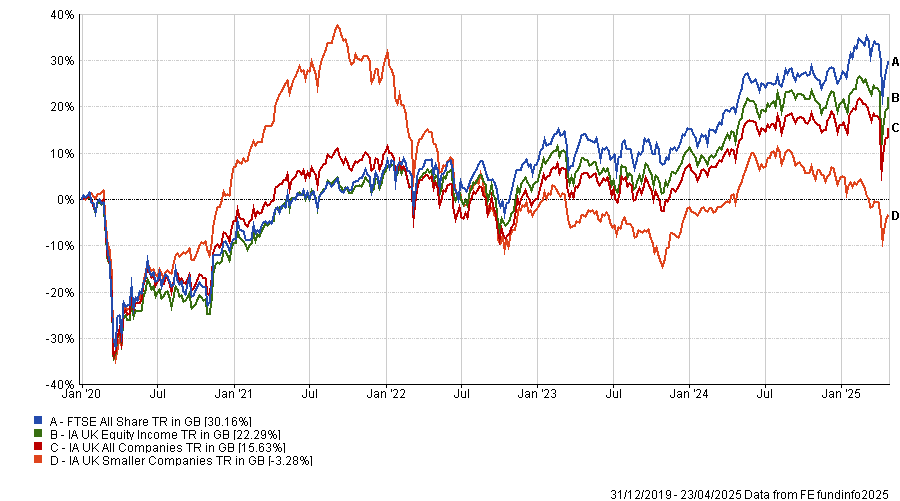
Source: FE Analytics.
This poor performance from active funds reflects the dominance of large stocks in the index, such as pharmaceutical giant AstraZeneca and oil titan Shell. While active managers may hold allocations towards these stocks, they may struggle to be overweight due to their weighting in the index.
Instead, active managers tend to hunt for shares further down the market-cap spectrum, impacting their performance against the market.
In total, 19% of the IA UK All Companies sector has beaten the FTSE All-Share, while 23% of the IA UK Equity Income sector achieved the feat. In the small-cap arena, 22% were ahead of the Deutsche Numis Smaller Companies Excluding Investment Companies index (a more relevant benchmark), while three funds were able to beat the FTSE All Share.
Conclusion: Buy a large-cap tracker
The data indicates the best way to invest in the UK during times of market dislocation is just to buy a large-cap tracker. At least, that is what would have worked over the past five years.
In this regard, investors are spoilt for choice, with many firms now offering a range of passive index trackers which have proven very popular amongst investors. For example, the Vanguard FTSE UK All Share Index UK Unit trust has more than £14bn in assets under management, making it the largest and most popular fund in the IA UK All Companies sector. It tracks the FTSE All Share for an ongoing charges figure (OCF) of 0.06%, making it one of the cheapest funds on the market.
However, this is not to say active management does not have a place. While the average active fund failed to beat the market, some did manage to deliver.
The table below shows the 10 best-performing funds in the UK market since the beginning of 2020, all of which beat the FTSE All Share. Six funds are in the IA UK All Companies sector, while four are in the IA UK Equity Income sector.
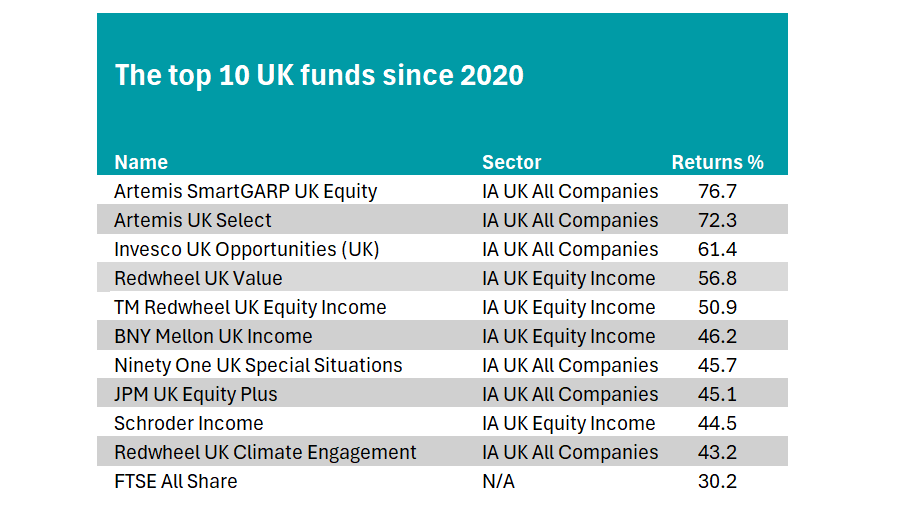
Source: FE Analytics
Top of the list is the Artemis SmartGARP UK Equity fund (growth at a reasonable price). Managed by experienced stockpicker Philip Wolstencroft, Shell and GSK are the only two holdings in its top 10 that are also in the top 10 of the FTSE All Share. Otherwise, it is very different to the standard tracker.
It is followed by another strategy from the Artemis team, Ed Legget and Ambrose Faulks’ Artemis UK Select fund. It has significant allocations towards three of the FTSE All Share’s largest constituents – Shell, HSBC and Rolls-Royce.
Three strategies from the team of Ian Lance and Nick Purves also beat the benchmark - Redwheel UK Value, Redwheel UK Equity Income and Redwheel UK Climate Engagement.
Other funds to qualify include: Invesco UK Opportunities fund, Ninety One UK Special Situations, JPM UK Equity Plus, Schroders Income and BNY Mellon UK Income.